Новости о Analyst Chart [ Фото новости ] [ Свежие новости ] | |

Crypto Analyst Says A Full Blown Altseason Might Be On The Horizon: Points To The Interesting Ethereum/Bitcoin Chart Structure
According to a recent tweet by analyst Alex Wacy, the ETH/BTC chart is signaling a potential strong momentum ahead, suggesting that a full-blown altseason might be on the horizon. Since October, altcoins have been gradually gaining momentum alongside the overall market, but they have not yet fully flexed their strength. дальше »
2024-4-30 11:00 | |
|
|

Crypto set to hit 1 billion users by end of 2025, says analyst
Bitcoin analyst Willy Woo has presented a model that forecasts the cryptocurrency industry reaching its first billion users by the end of 2025. This prediction, detailed in a chart by Woo, represents a significant milestone in mainstream crypto adoption, indicating a potential major influx of capital and subsequent price appreciation for digital assets. Current user […] дальше »
2024-4-30 18:45 | |
|
|
Top Analyst Spots Buy Signal for Chainlink (LINK) Above This Support, Shares Price Target
A popular crypto analyst known as Ali on X is calling attention to a promising technical pattern emerging on the charts for Chainlink (LINK). According to Ali’s latest analysis, the TD Sequential indicator is flashing a buy signal on LINK’s 12-hour chart. дальше »
2024-4-29 00:15 | |
|
|

Bitcoin Primed For November 2020-Esque Meteoric Price Growth Amid Extreme Compression: Pundit
Anonymous analyst TechDev took to X to note that BTC’s two-month chart conditions indicate that Bitcoin is about to go turbo-parabolic. дальше »2024-4-28 22:19 | |
|
|
Analyst Who Called Shiba Inu’s Previous 224% Rally Sights Potential for Another SHIB Surge Following This Breakout
A popular crypto analyst known as “ChartMonkey” on X has set his sights on Shiba Inu (SHIB), predicting a potential rally for the meme cryptocurrency. In a recent tweet, ChartMonkey highlighted a pattern forming on the SHIB/USDT chart, which he believes could lead to a significant price surge. дальше »
2024-4-26 21:15 | |
|
|

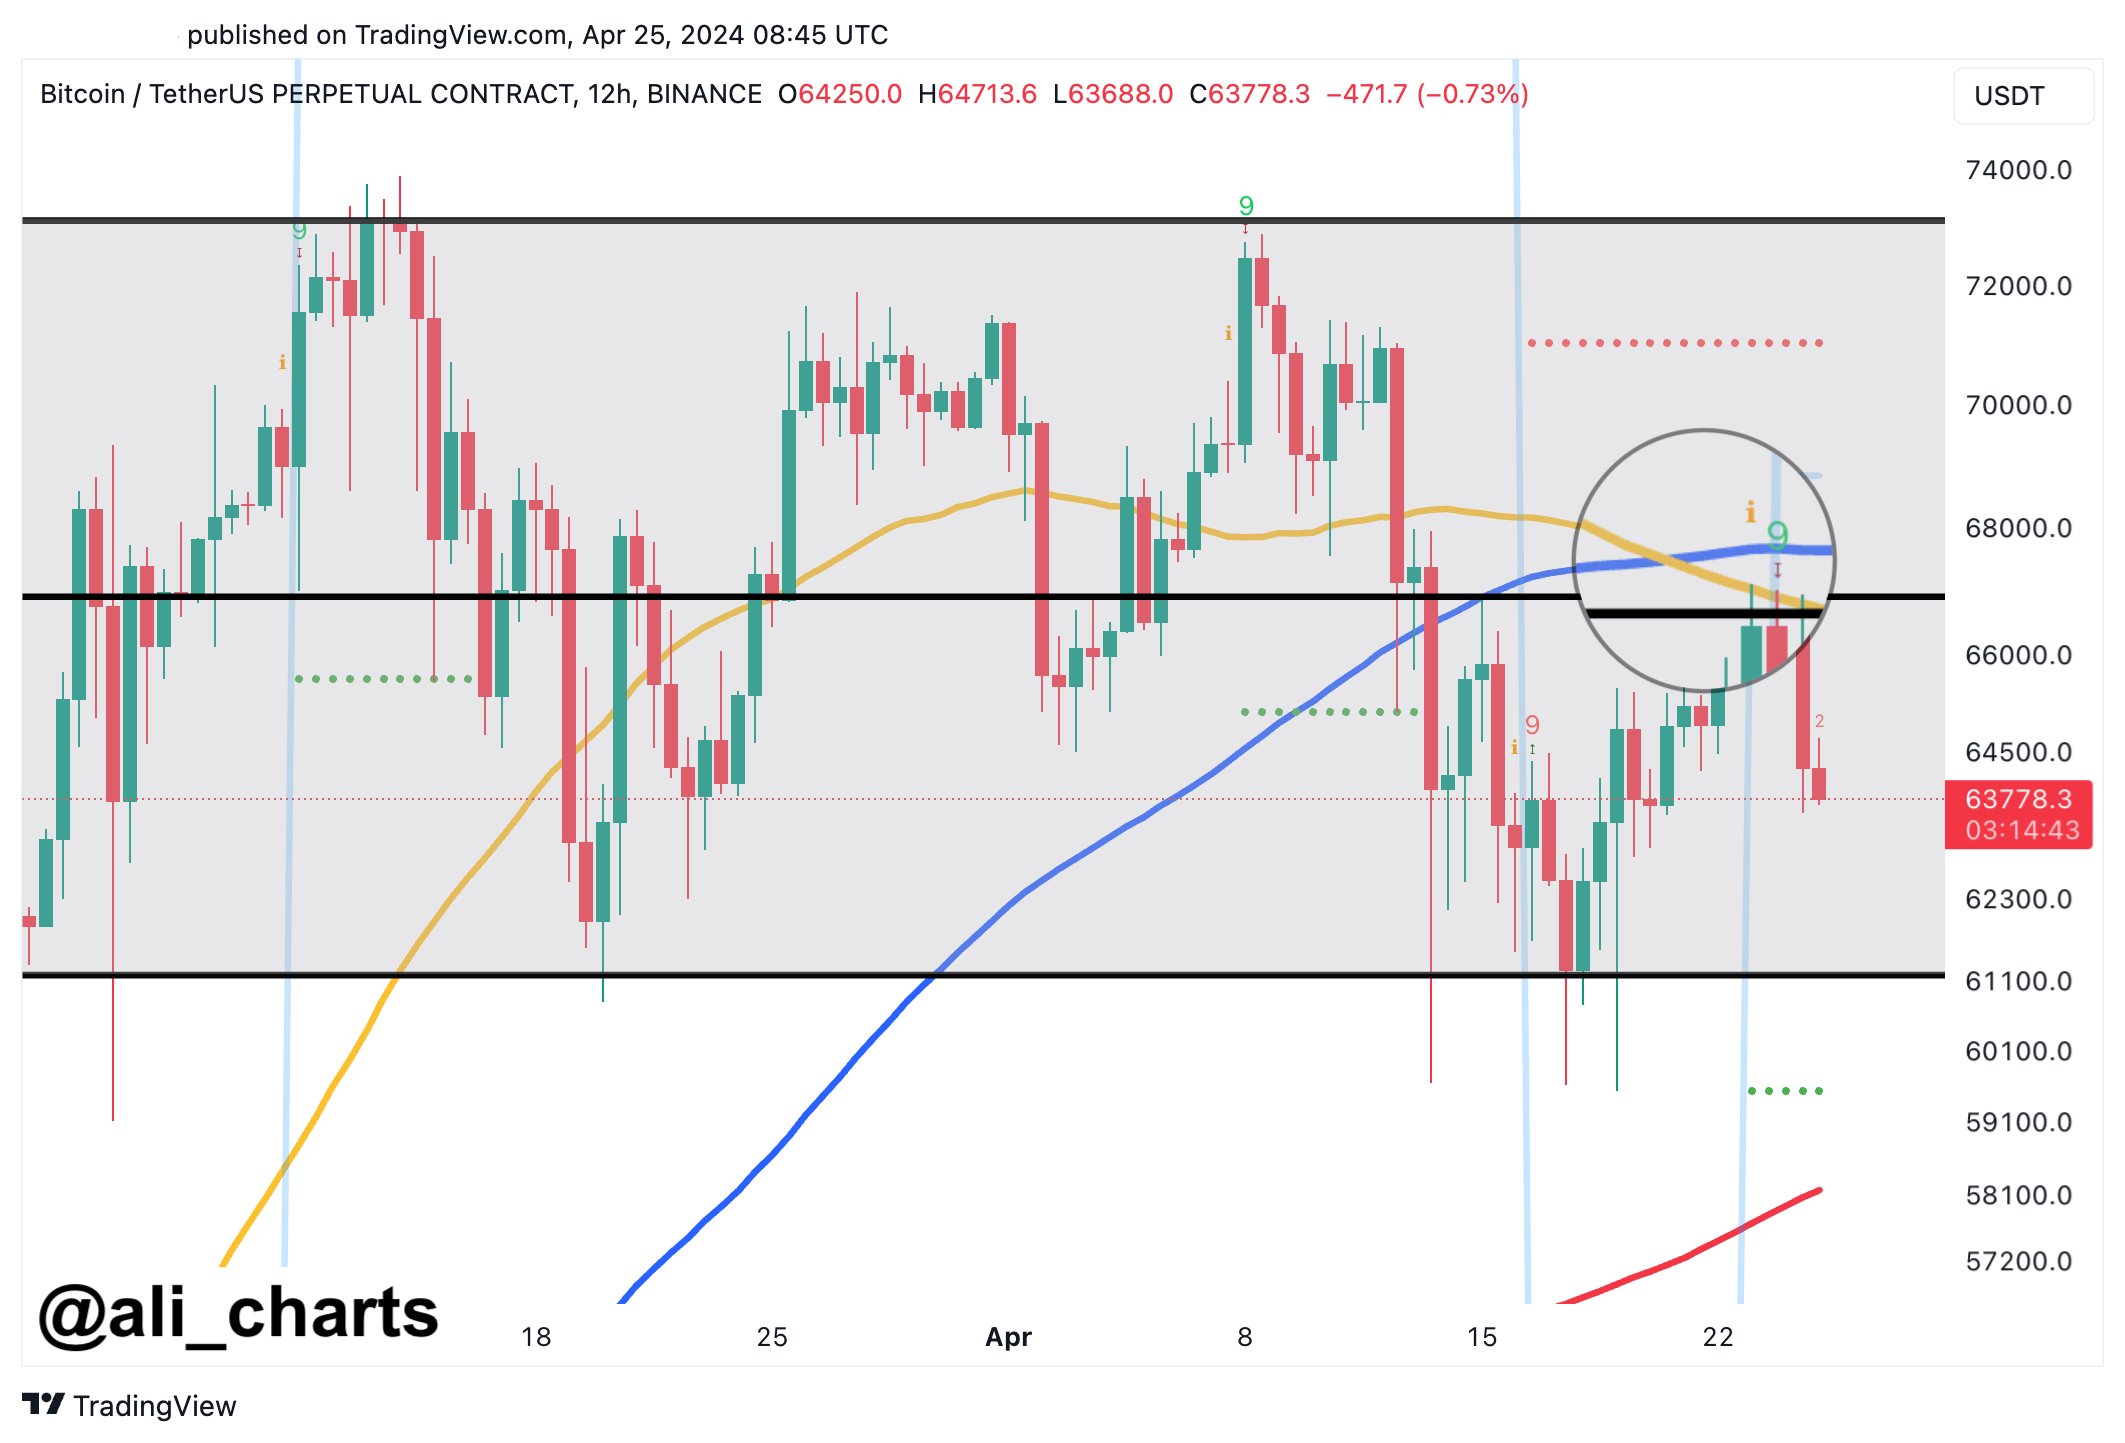
Bitcoin Forms Death Cross & TD-9 Sell Signal: Brace For Impact?
An analyst has explained how Bitcoin is forming both a death cross and TD sell signal, which may lead to potential dips in these targets. Bitcoin Looking In Trouble As 12-Hour Chart Forms Two Bearish Signals In a new post on X, analyst Ali discussed two signals that have recently formed in Bitcoin’s 12-hour chart. дальше »
2024-4-26 00:00 | |
|
|
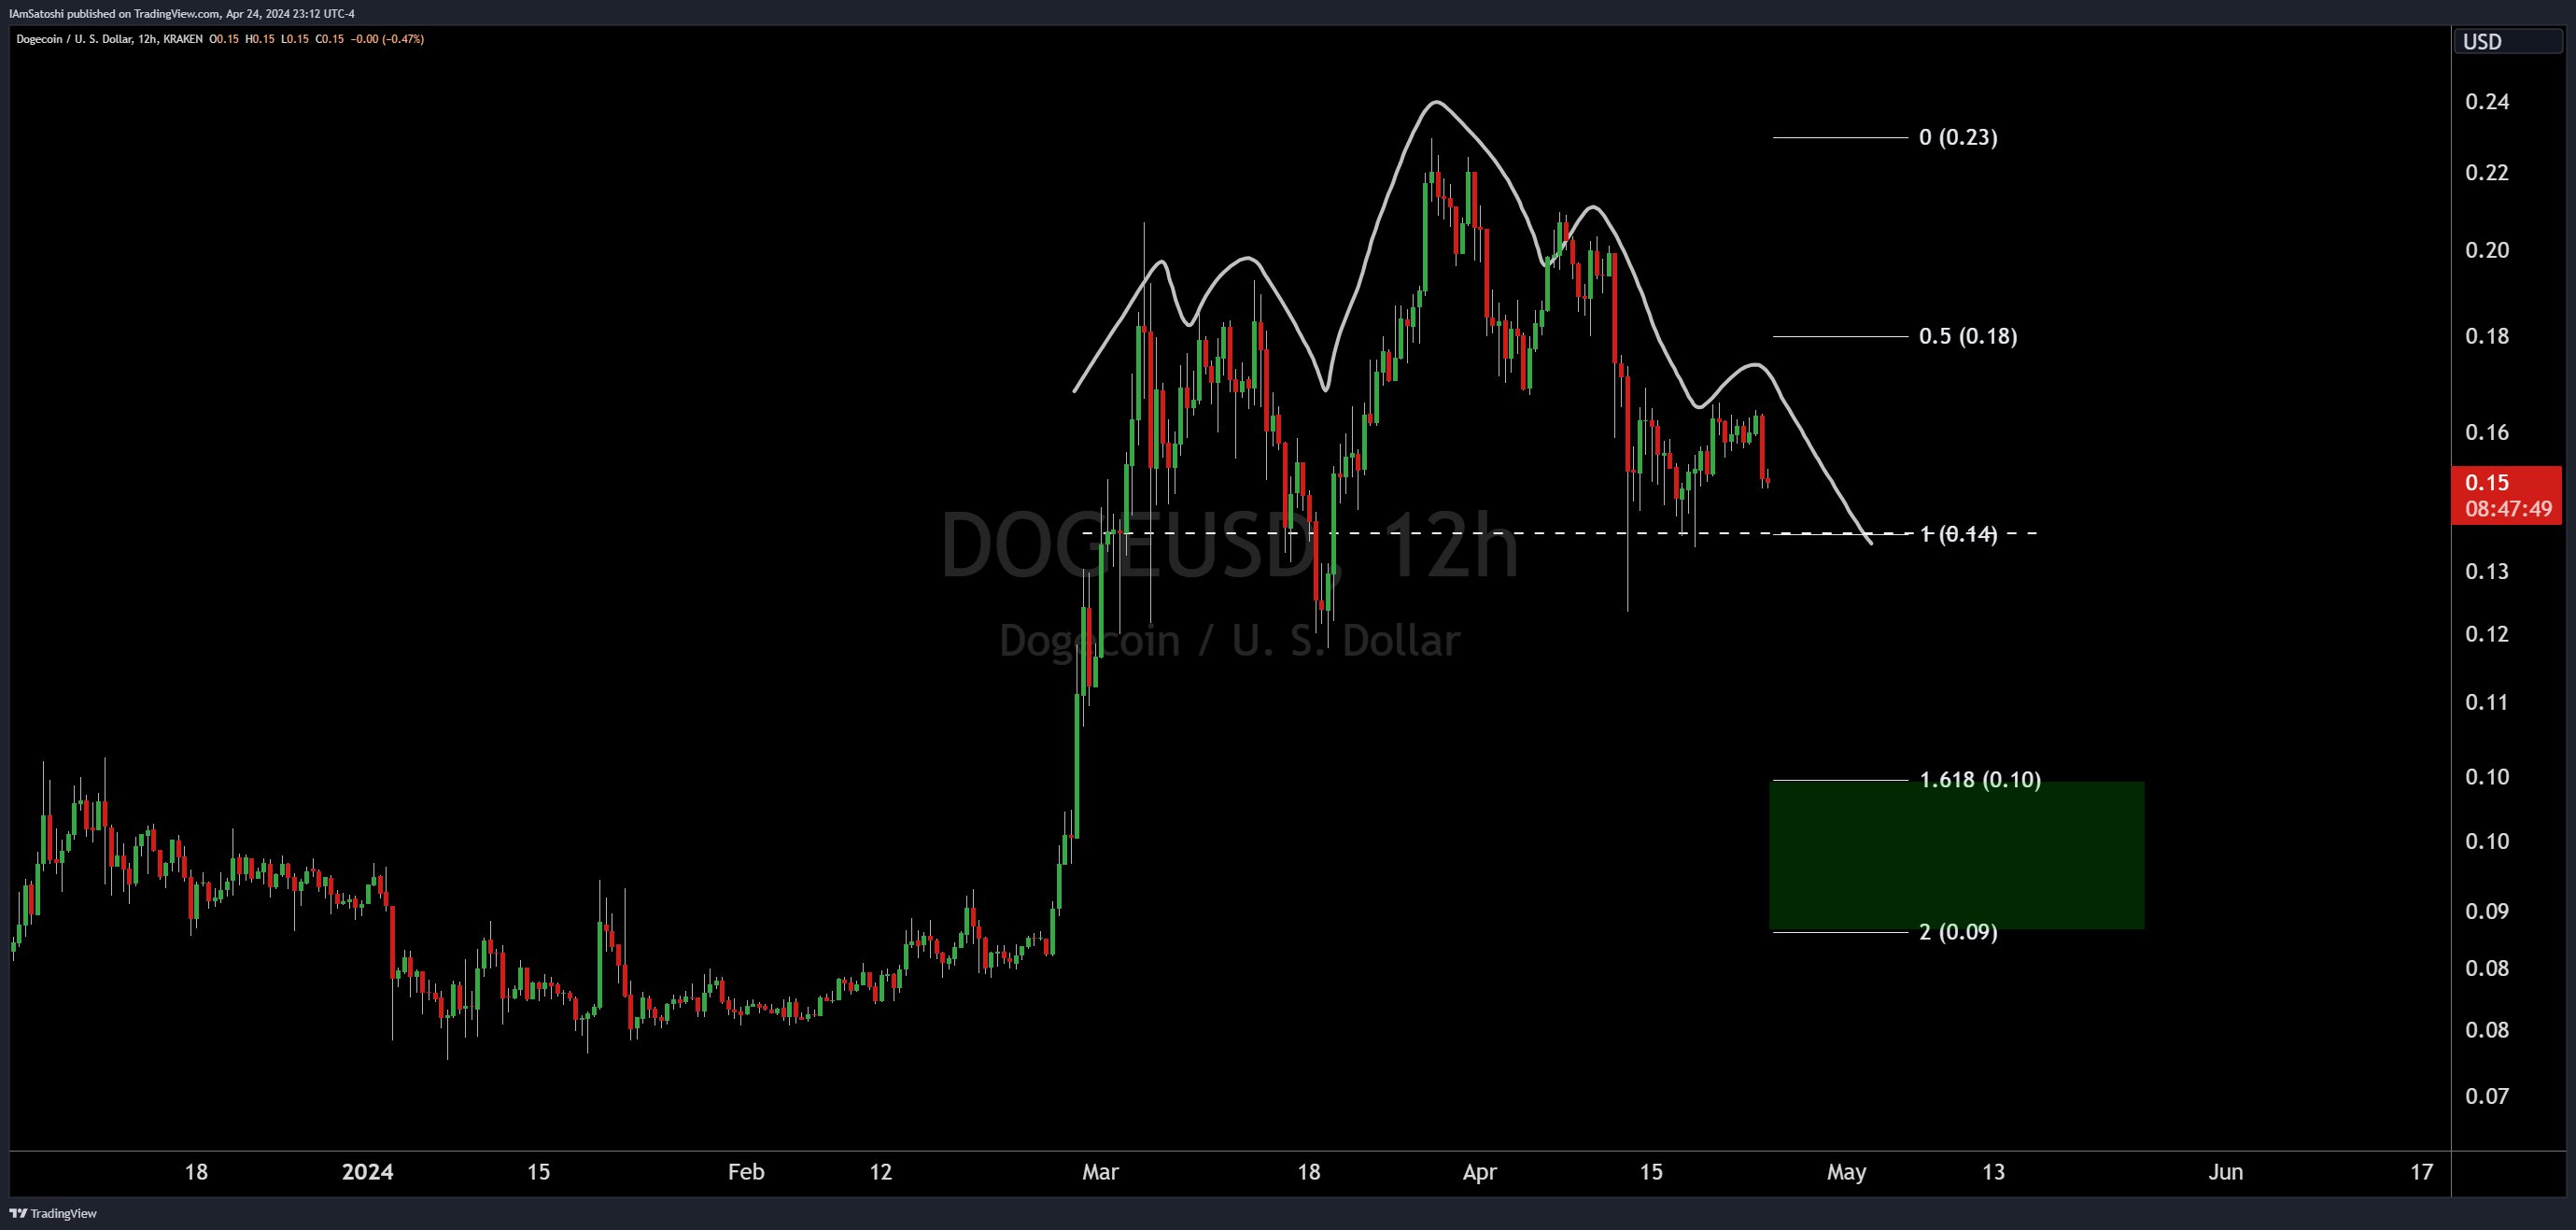
Head And Shoulders Alert: Dogecoin Could See A Price Crash Soon
Crypto analysts are sounding the alarm on Dogecoin as a classic chart pattern, known for predicting bearish trends, has emerged. Technical analyst Josh Olszewicz, @CarpeNoctom, flagged a potential Head and Shoulders (H&S) formation on the DOGE/USD 12-hour chart on X, hinting at a possible significant price drop if the pattern validates. дальше »
2024-4-25 10:30 | |
|
|
Bullish Breakout Imminent for BONK Memecoin: Analyst Highlights Emerging Cup and Handle Pattern – What to Watch
Sjuul | AltCryptoGems, a top analyst, has identified potential bullish signals for the digital asset $BONK. In a tweet, the analyst shared a chart analysis, highlighting key patterns and levels that could suggest a favorable outlook for $BONK. дальше »
2024-4-23 18:30 | |
|
|
Dogecoin Chart Flashes Buy Signal, Can DOGE Price Reach $1?
Crypto analyst Ali Martinez has provided a bullish narrative for the foremost meme coin, Dogecoin (DOGE). Based on his recent analysis, there is a likelihood that Dogecoin can hit $1 sooner rather than later. дальше »
2024-4-23 01:30 | |
|
|
Analyst Forecasts Dogecoin (DOGE) Memecoin Price Surge to $1: Here’s His Outlook
Dogecoin (DOGE), the iconic memecoin, is exhibiting its classic bullish pattern, according to crypto analyst Ali, suggesting a potential surge towards the $1 mark in the coming weeks. Ali, known for his insightful chart analysis on X, has spotted a familiar trend in Dogecoin’s price movements. дальше »
2024-4-21 17:30 | |
|
|
Uniswap (UNI) Gearing Up for Potential 4-Day Rally, Here Are the Levels to Watch
The cryptocurrency market has been abuzz with speculation surrounding the potential rally of Uniswap (UNI), the native token of the leading decentralized exchange (DEX) Uniswap. According to prominent crypto analyst Ali (@ali_charts), the TD Sequential indicator has flashed a buy signal on the daily chart for UNI, suggesting that the token might be gearing up […] The post Uniswap (UNI) Gearing Up for Potential 4-Day Rally, Here Are the Levels to Watch appeared first on CaptainAltcoin. дальше »
2024-4-20 23:30 | |
|
|
Top Analyst Sees Bright Horizon for SUI; Urges Calculated Patience for Injective (INJ) – Here’s His Outlook
Top crypto analyst Crypto Tony has shared his insights on the potential trajectories of two digital assets, SUI and INJ. His comprehensive chart analysis highlights market patterns, support/resistance levels, and candlestick formations, offering guidance to traders and investors. дальше »
2024-4-19 00:30 | |
|
|
Ripple’s XRP Chart Is ‘Not Looking Good’: Could Dip 60% More if This Support Breaks
A popular crypto analyst on X, known as @ChartMonkeyBTC, has issued a dire warning about the future price trajectory of Ripple’s XRP token. According to the analyst’s technical analysis, XRP’s chart is “not looking good,” and the cryptocurrency could potentially dip by a staggering 60% from its current levels if a critical support level fails […] The post Ripple’s XRP Chart Is ‘Not Looking Good’: Could Dip 60% More if This Support Breaks appeared first on CaptainAltcoin. дальше »
2024-4-19 23:30 | |
|
|
Dogecoin Flashes Weekly Golden Cross: Why This Analyst Believes The Bull Rally Is Far From Over
A crypto analyst known as Yomi has noted that the Dogecoin recent price action could turn bullish after this week. According to Yomi, DOGE is on the verge of creating a golden cross on its price chart, an event that could indicate the continuation of a major bull run. дальше »
2024-4-16 02:00 | |
|
|
Crypto Analyst Predicts Altcoin Market Surge: A Bullish Future Beyond This Key Resistance
Crypto analyst Rekt Capital shared insights on the altcoin market capitalization lately, suggesting a bullish trajectory ahead. In a tweet, Rekt Capital stated, “$ALTS Altcoin Market Cap following the plan…” accompanied by a revealing chart analysis. дальше »
2024-4-15 17:45 | |
|
|
Litecoin (LTC) Poised for Breakout: Key Signals Point to Surge Towards These New Price Targets
According to the crypto analyst World Of Charts, Litecoin (LTC) appears poised for a substantial recovery in the coming weeks. The analyst’s chart analysis reveals the formation of a bullish pennant pattern, suggesting a potential breakout and a price target between $130 and $135. дальше »
2024-4-12 17:30 | |
|
|
Chainlink at a Crossroads: Will LINK’s Bullish Falling Wedge Lead to a Breakout? Key Metrics to Watch
Chainlink (LINK), the decentralized oracle network, finds itself in a critical juncture as it grapples with a potential bullish reversal, according to crypto analyst Daan Crypto Trades. In a tweet, the analyst shared a chart highlighting Chainlink’s price action and the pivotal levels that could dictate its future trajectory. дальше »
2024-4-11 23:45 | |
|
|
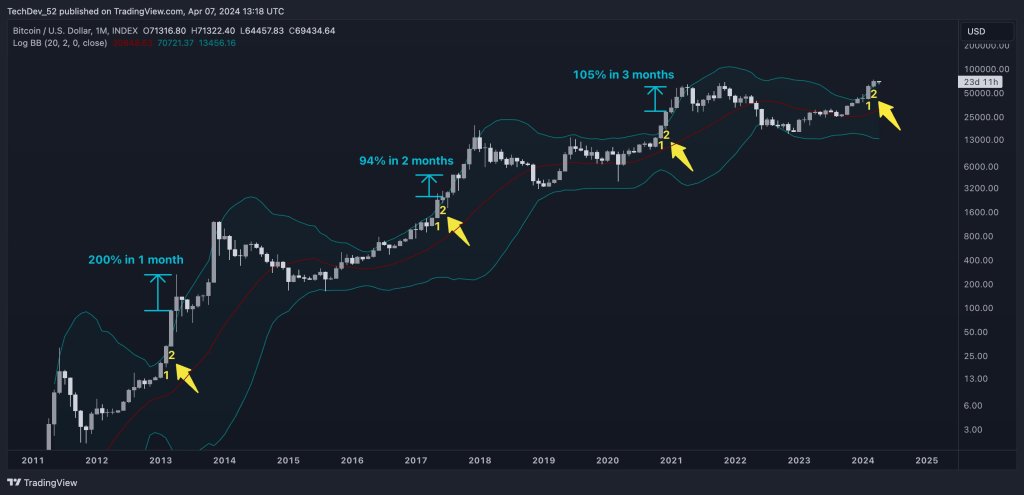
Bitcoin Can Reach $140,000 After This Rare Signal Prints: Analyst
Bitcoin may be hovering below its all-time highs, but analysts are turning bullish based on a rare chart formation. Taking to X, the analyst observed that BTC has closed two consecutive months above the upper Bollinger Band on the monthly chart. дальше »
2024-4-9 22:00 | |
|
|
Bullish Horizon: Cardano (ADA) Eyes This Next Price Level After Key Breakout
Cardano (ADA) has exhibited a promising technical pattern that could fuel a significant price surge igniting anticipation in the crypto market. World Of Charts (@WorldOfCharts1), a top crypto analyst, has identified a breakout from a falling wedge pattern in ADA’s 4-hour chart, signaling a bullish outlook for the digital asset. дальше »
2024-4-8 21:15 | |
|
|
Crypto Analyst Identifies Potential ONDO Breakout Opportunity: Here’s His Outlook
Cryptocurrency trader Daan Crypto Trades has identified an intriguing chart pattern for the ONDO token that could present a buying opportunity if broader market conditions are favourable. ONDO’s Intriguing Chart Pattern According to Daan Crypto Trades, the chart for the ONDO cryptocurrency against the USDT stablecoin presents an intriguing setup. дальше »
2024-4-4 23:15 | |
|
|
Shiba Inu To Rally 100% To $0.000062? Analyst Reveals Why This Is Possible
A crypto analyst has identified a key technical indicator in the Shiba Inu price chart that suggests that the cryptocurrency is set to witness a major price rally to new highs. Asymmetrical Triangle Signaling SHIB Price Surge Appears A crypto analyst identified as Captain Faibik on X (formerly Twitter) has unveiled a distinctive technical pattern in Shiba Inu’s price chart. дальше »
2024-4-3 21:00 | |
|
|
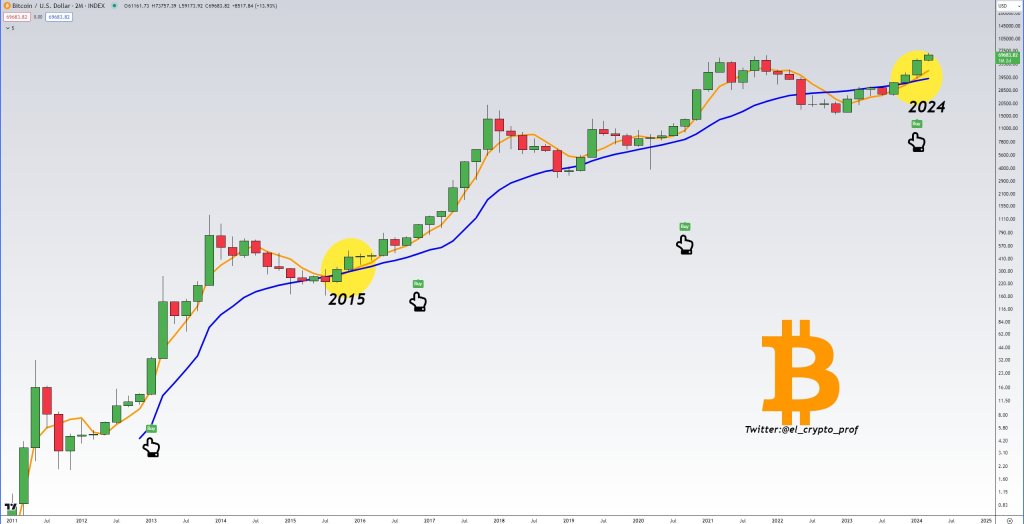
Bitcoin Ready To Rip? Indicator Prints Bullish Signal After 9 Years
One analyst on X thinks Bitcoin bulls may be in for a treat in the coming months after one key indicator printed a buy signal for the first time in nearly a decade. While pointing to a bullish crossover on the 2-month chart’s Golden Moment Indicator, the analyst said the signal is again flashing green in almost nine years. дальше »
2024-3-29 19:00 | |
|
|
Bitcoin’s Inverse Head and Shoulders Pattern Indicates Where BTC Price Is Headed Short Term
According to cryptocurrency analyst Jesper, Bitcoin’s recent price action has formed a textbook “inverse head and shoulders” pattern on the 30-minute chart, a bullish technical formation that could pave the way for further gains in the short term. дальше »
2024-3-24 14:30 | |
|
|
Ripple (XRP) Forecasted to Hit $17: Here’s When
XRP, the native token of the Ripple blockchain, is poised for significant price appreciation in the coming months, according to a recent analysis. The analyst, who prefers not to engage in precise market timing, has nonetheless ventured to provide two potential price targets based on ascending triangle chart patterns. дальше »
2024-3-11 11:52 | |
|
|
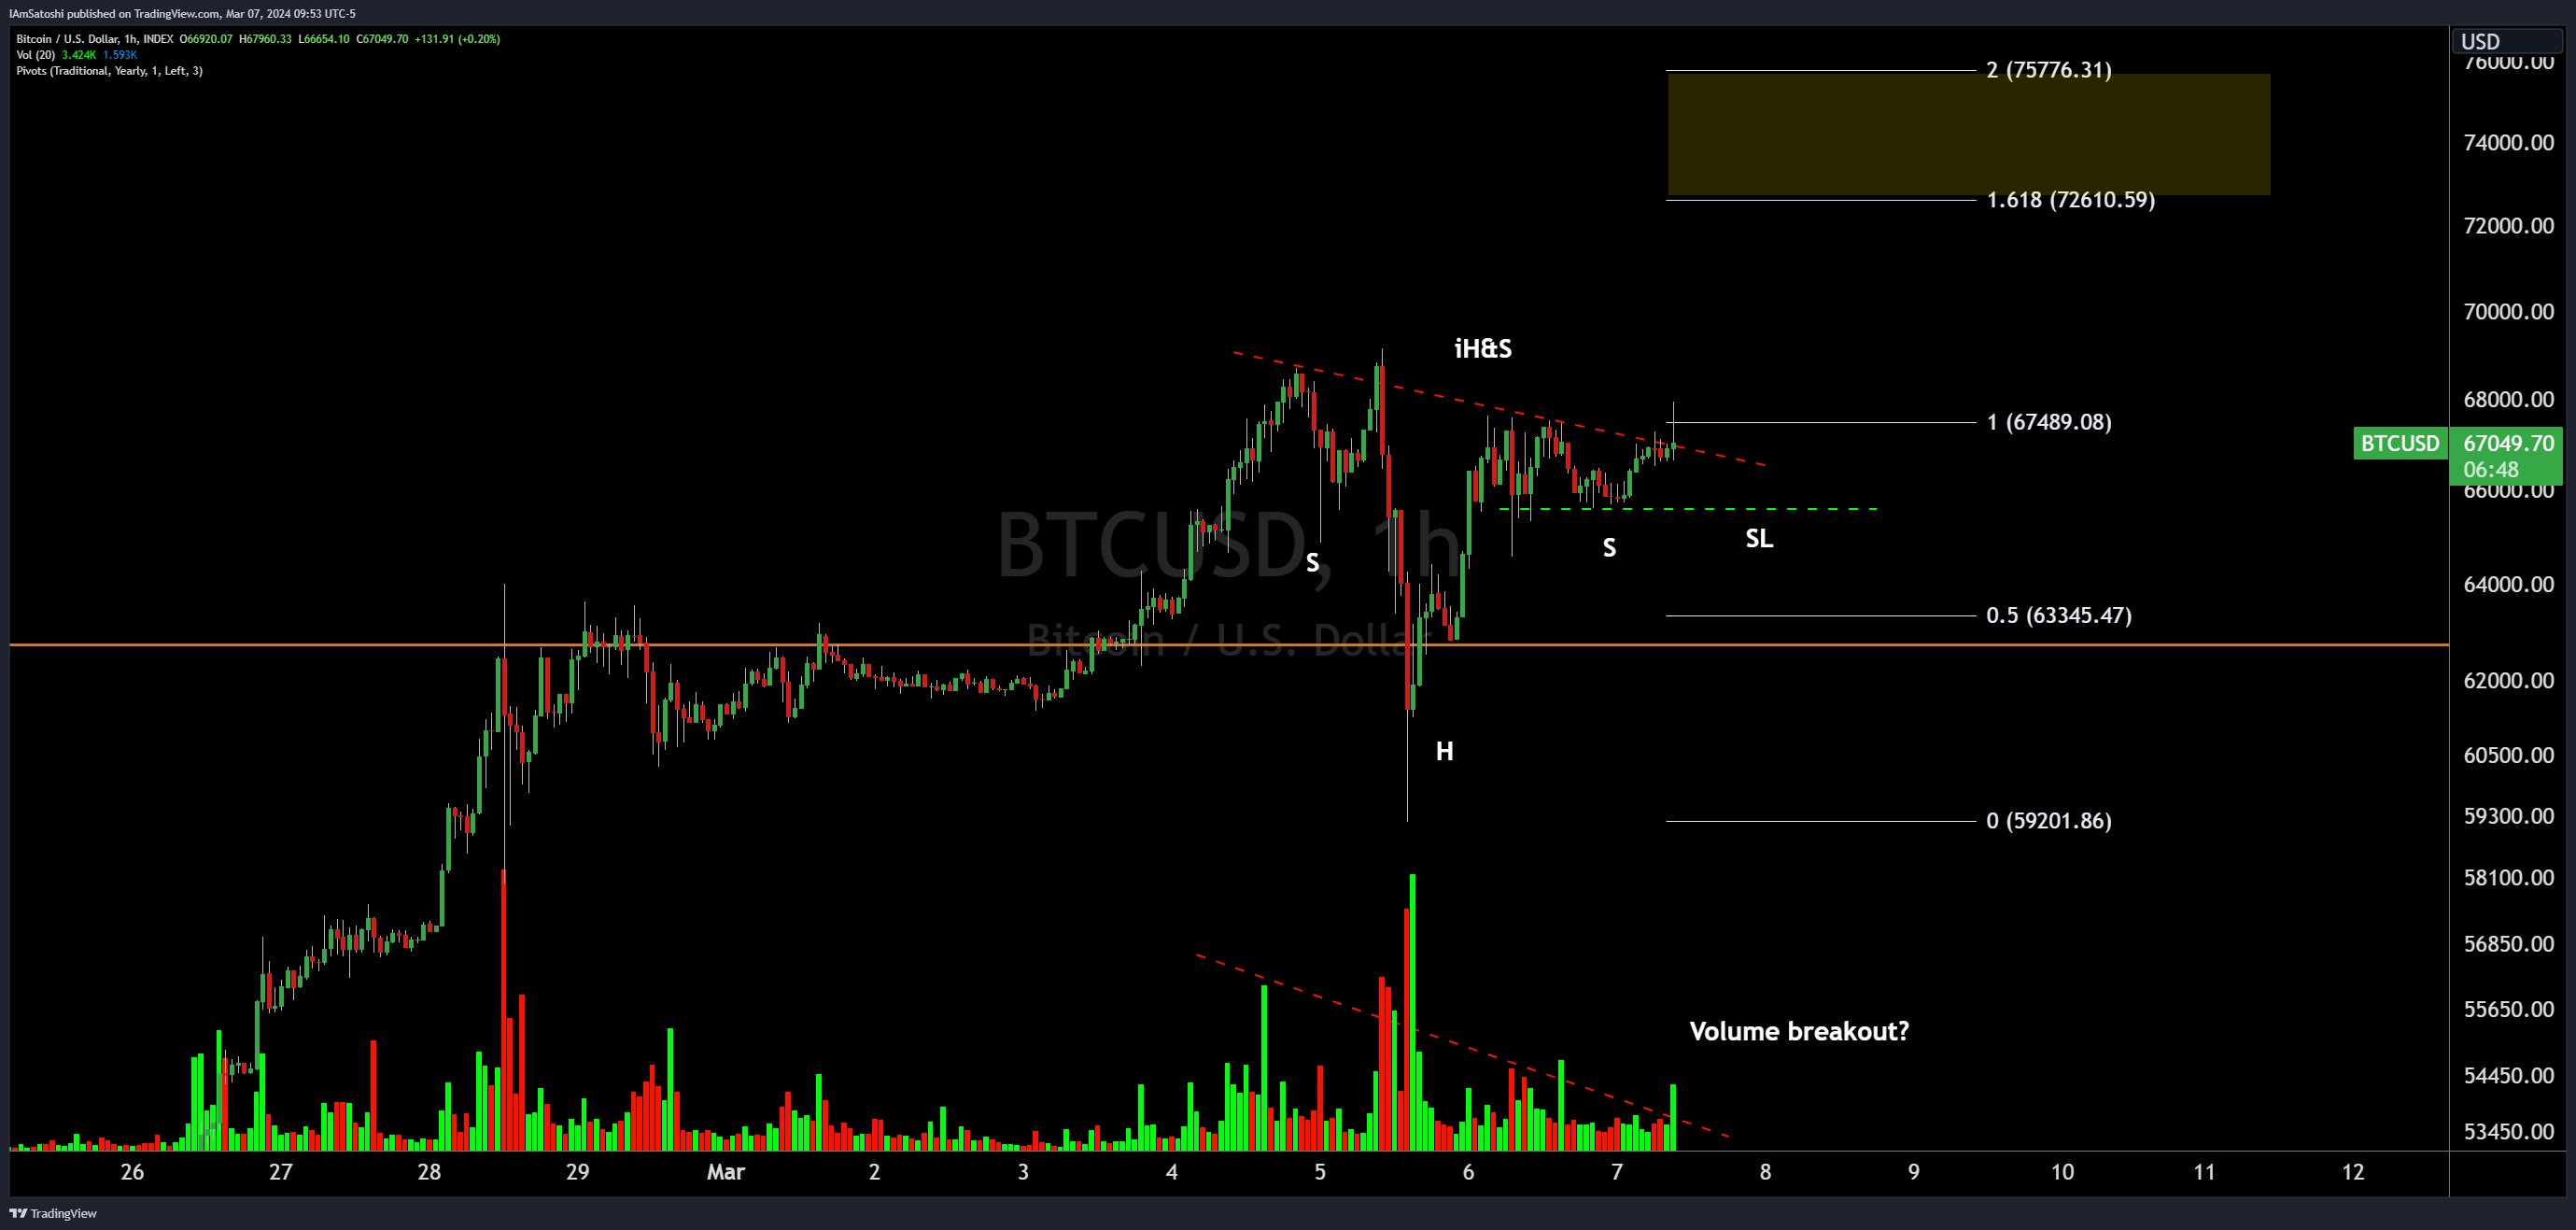
Bitcoin Price Forms Inverse Head And Shoulders Pattern, Eyes $76,000
Just below the all-time high of $69,000, the Bitcoin price has shown more volatility in recent days, only to now tread water around $67,000. But this boredom could soon be over. Following the recent price movements, a notable pattern has emerged on the Bitcoin (BTC) price chart, as recognized by the seasoned crypto analyst Josh Olszewicz. дальше »
2024-3-8 11:30 | |
|
|
Polkadot Going According to Top Analyst’s Prediction; DOT Must Now Close Above This Level for Bullish Continuation
Notable cryptocurrency analyst Rekt Capital (@rektcapital) posted a Polkadot (DOT) price chart analysis on Twitter, stating that price action has followed his prediction perfectly. According to Rekt Capital, Polkadot has rallied over 40% and adhered precisely to the “blue path” laid out in his previous analysis. дальше »
2024-2-29 20:30 | |
|
|
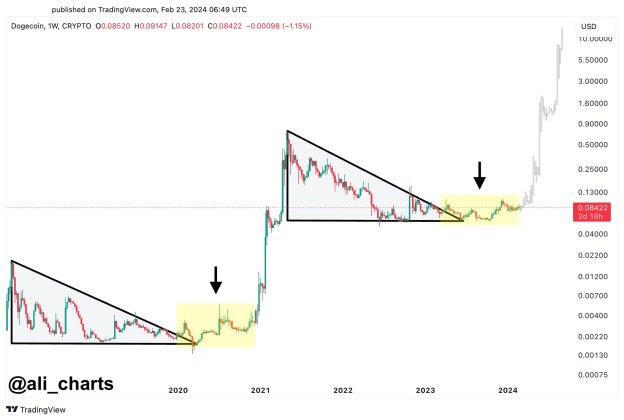
Dogecoin Patterns That Led To 28,000% Rally In 2020 Have Returned
Dogecoin is once again on the radar of crypto investors after multiple important patterns have made their way to the fore. This was pointed out by crypto analyst Ali Martinez, who identified multiple patterns similar to what was seen in 2020 that could result in a parabolic rally. дальше »
2024-2-24 01:00 | |
|
|
As Bitcoin (BTC) Charges On, This AVAX Metric May Signal Price Dips for Altcoins – But There’s a Catch
Cryptocurrency analyst Altcoin Sherpa warned regarding the potential for heavy capitulation across the altcoin market if key support levels fail. AVAX Chart Signals Broad Market Troubles In a tweet post, he highlighted Avalanche’s AVAX token as an important chart to monitor, cautioning that a decisive breakdown could spark a crisis of confidence rippling across cryptos […] The post As Bitcoin (BTC) Charges On, This AVAX Metric May Signal Price Dips for Altcoins – But There’s a Catch appeared first on CaptainAltcoin. дальше »
2024-2-24 23:30 | |
|
|
Top Analyst Reveals PEPE Price Levels to Watch as Bulls Target Over 100% Spike
Popular crypto analyst Ali (@ali_charts) has revealed key price levels to watch for PEPE, as bulls target over a 100% price spike from current levels. Technical Analysis Supports Upside for PEPE According to Ali, PEPE is showing signs of forming the right shoulder of a head-and-shoulders bottoming pattern on its 3-day chart. дальше »
2024-2-24 22:30 | |
|
|
Ripple Analyst Predicts $5.85 XRP as Next Target in Ongoing Bull Run – But There’s a Catch
XRP price has remained relatively flat this week, down a modest 1% to trade around $0. 54. Technical analysis shows that XRP recently broke out of a descending channel it had been stuck in since late November, marked by the blue lines on the price chart. дальше »
2024-2-23 21:00 | |
|
|
Solana Shows Imminent Breakout from Inverted Head and Shoulders Pattern; Analyst Predicts SOL Could Reach As High As This Level
Analyzing the SOL daily chart, Coinpedia spotlights the formation of a clear inverted head and shoulders pattern, typically signaling the end of a downtrend. SOL looks set to break above the neckline resistance around $115, which projects an ambitious upside target of $150 if historical precedents hold. дальше »
2024-2-19 12:30 | |
|
|
Polkadot (DOT) Bulls Must Defend Key Support Level For Price Recovery, Analyst Warns
Tony Bitcoin, a crypto analyst, warns that Polkadot’s DOT token must hold a key ascending support line to avoid further losses. According to Tony’s chart, DOT has repeatedly bounced off this ascending support over the past few months. дальше »
2024-2-18 13:30 | |
|
|
SingularityNET’s AGIX Surges as Cup and Handle Pattern Breaks: How High Can the Price Go in This Move?
Cryptocurrency analyst CryptoBull_360 tweeted that AI token SingularityNET (AGIX) is breaking out from a bullish cup and handle pattern on the daily chart. This technical pattern involves a U-shaped “cup” consolidation followed by a smaller “handle” consolidation before a major breakout. дальше »
2024-2-16 17:12 | |
|
|
Bullish Pennant Pattern Suggests Injective Protocol Is Ready to Surge 40% from This Price: INJ Price Outlook
Popular crypto analyst X account ChartMonkeyBTC posted a technical analysis of the Injective Protocol token (INJ). The automated post highlighted a bullish pennant pattern forming on INJ’s 12-hour price chart, suggesting the potential for a significant price increase of 35-40% soon. дальше »
2024-2-10 19:59 | |
|
|
Conflicting Cardano (ADA) Metrics Could Stop Bulls’ Efforts To Break This Critical Resistance Level
X Analyst @Av_Sebastian pointed out that Cardano (ADA) has been showing signs of strength on the 4-hour chart. He believes that ADA will likely retest the $0. 55 resistance level soon, which will be a critical point that determines if the price can move higher. дальше »
2024-2-10 18:51 | |
|
|
Bitcoin: Analyst explains why it's still not too late to buy BTC at $45,000
Bitcoin surged past $45,000 on the charts Dan the Chart Man is advocating for strategic buying during tight-range breakouts For the first time since mid-January, Bitcoin (BTC) has finally brThe post Bitcoin: Analyst explains why it's still not too late to buy BTC at $45,000 appeared first on AMBCrypto. дальше »
2024-2-9 13:30 | |
|
|
Top Analyst Predicts “Massive Pump” for Shiba Inu’s SHIB: Bulls Target $0.01
Popular meme coin Shiba Inu (SHIB) has seen a resurgence of interest from investors and traders this week thanks to some positive price action. Several crypto influencers have noted bullish patterns emerging in the price chart that could indicate bigger moves ahead. дальше »
2024-2-9 23:16 | |
|
|
Crypto Expert Forecasts Price Decline for Cardano’s ADA if This Key Resistance Continues to Hold
Popular crypto analyst Rekt Capital posted a technical analysis of Cardano’s (ADA) monthly price chart, warning that ADA could see further downside if it continues to face selling pressure at a key resistance level. дальше »
2024-2-3 23:30 | |
|
|
Bitcoin Stock-to-Flow Creator Buys the Dip, Is the Price Model Still Valid?
Popular Bitcoin chart analyst and investor ‘PlanB’ continues to buy the dip highlighting how many times the asset has been proclaimed ‘dead.’ The post Bitcoin Stock-to-Flow Creator Buys the Dip, Is the Price Model Still Valid? appeared first on BeInCrypto. дальше »
2022-10-3 07:15 | |
|
|
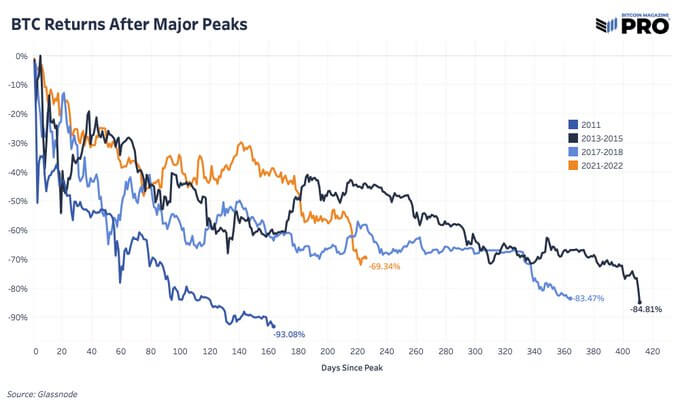
Analysis of previous Bitcoin bottoms suggests more pain to come
Market Analyst at Bitcoin Magazine, Sam Rule, tweeted a comparative chart of Bitcoin returns over the last four significant peaks. The post Analysis of previous Bitcoin bottoms suggests more pain to come appeared first on CryptoSlate. дальше »
2022-6-23 14:30 | |
|
|
Peter Brandt: BTC Could Drop to $13,000 and Enter ‘Drano Chart Pattern’
Peter Brandt, the analyst who predicted the crypto winter of 2018, has said that Bitcoin could continue to drop to $13,000. The post Peter Brandt: BTC Could Drop to $13,000 and Enter ‘Drano Chart Pattern’ appeared first on BeInCrypto. дальше »
2022-6-16 03:43 | |
|
|

Bitcoin RSI Looking Incredibly Bullish As BTC Bulls Strive To Reclaim $40k
Key Takeaways Bitcoin RSI points toward an upward rerun. Analyst PlanB brands the move bullish. The metric comes as Bitcoin strives to reclaim $40,000. A look into the BTC chart with the RSI indicator proclaims glad tidings to BTC hodlers in a rather uncertain market. дальше »
2022-2-22 19:46 | |
|
|
Quant Explains How Gemini Netflow Can Predict Bitcoin Tops
Quant explains how there may be a correlation between the Gemini Bitcoin netflow and BTC price tops, based on pattern of the last few years. Can Gemini Netflow Predict Bitcoin’s Price Tops? As posted by an analyst on CryptoQuant, the historical chart for the Gemini netflow (30-day MA) vs the price reveals there could be a correlation between the indicator and BTC tops. дальше »
2021-9-15 22:00 | |
|
|
Analyst on Bitcoin: This is 'a very strong sign of...'
For one whole day, after some pretty monotonous consolidations and devastating price dips, Bitcoin price candles were green on a one-hour, four-hour, and one-day chart. With this latest movement, markThe post Analyst on Bitcoin: This is 'a very strong sign of...' appeared first on AMBCrypto. дальше »
2021-7-28 15:00 | |
|
|