2020-10-13 13:00 |
Ethereum has undergone a strong rejection since reaching the summer highs of $490. The leading cryptocurrency fell from those highs to a recent September low of $315, liquidating many investors in the process.
While the cryptocurrency remains on shaky footing, Ethereum is expected to move dramatically higher in the months ahead.
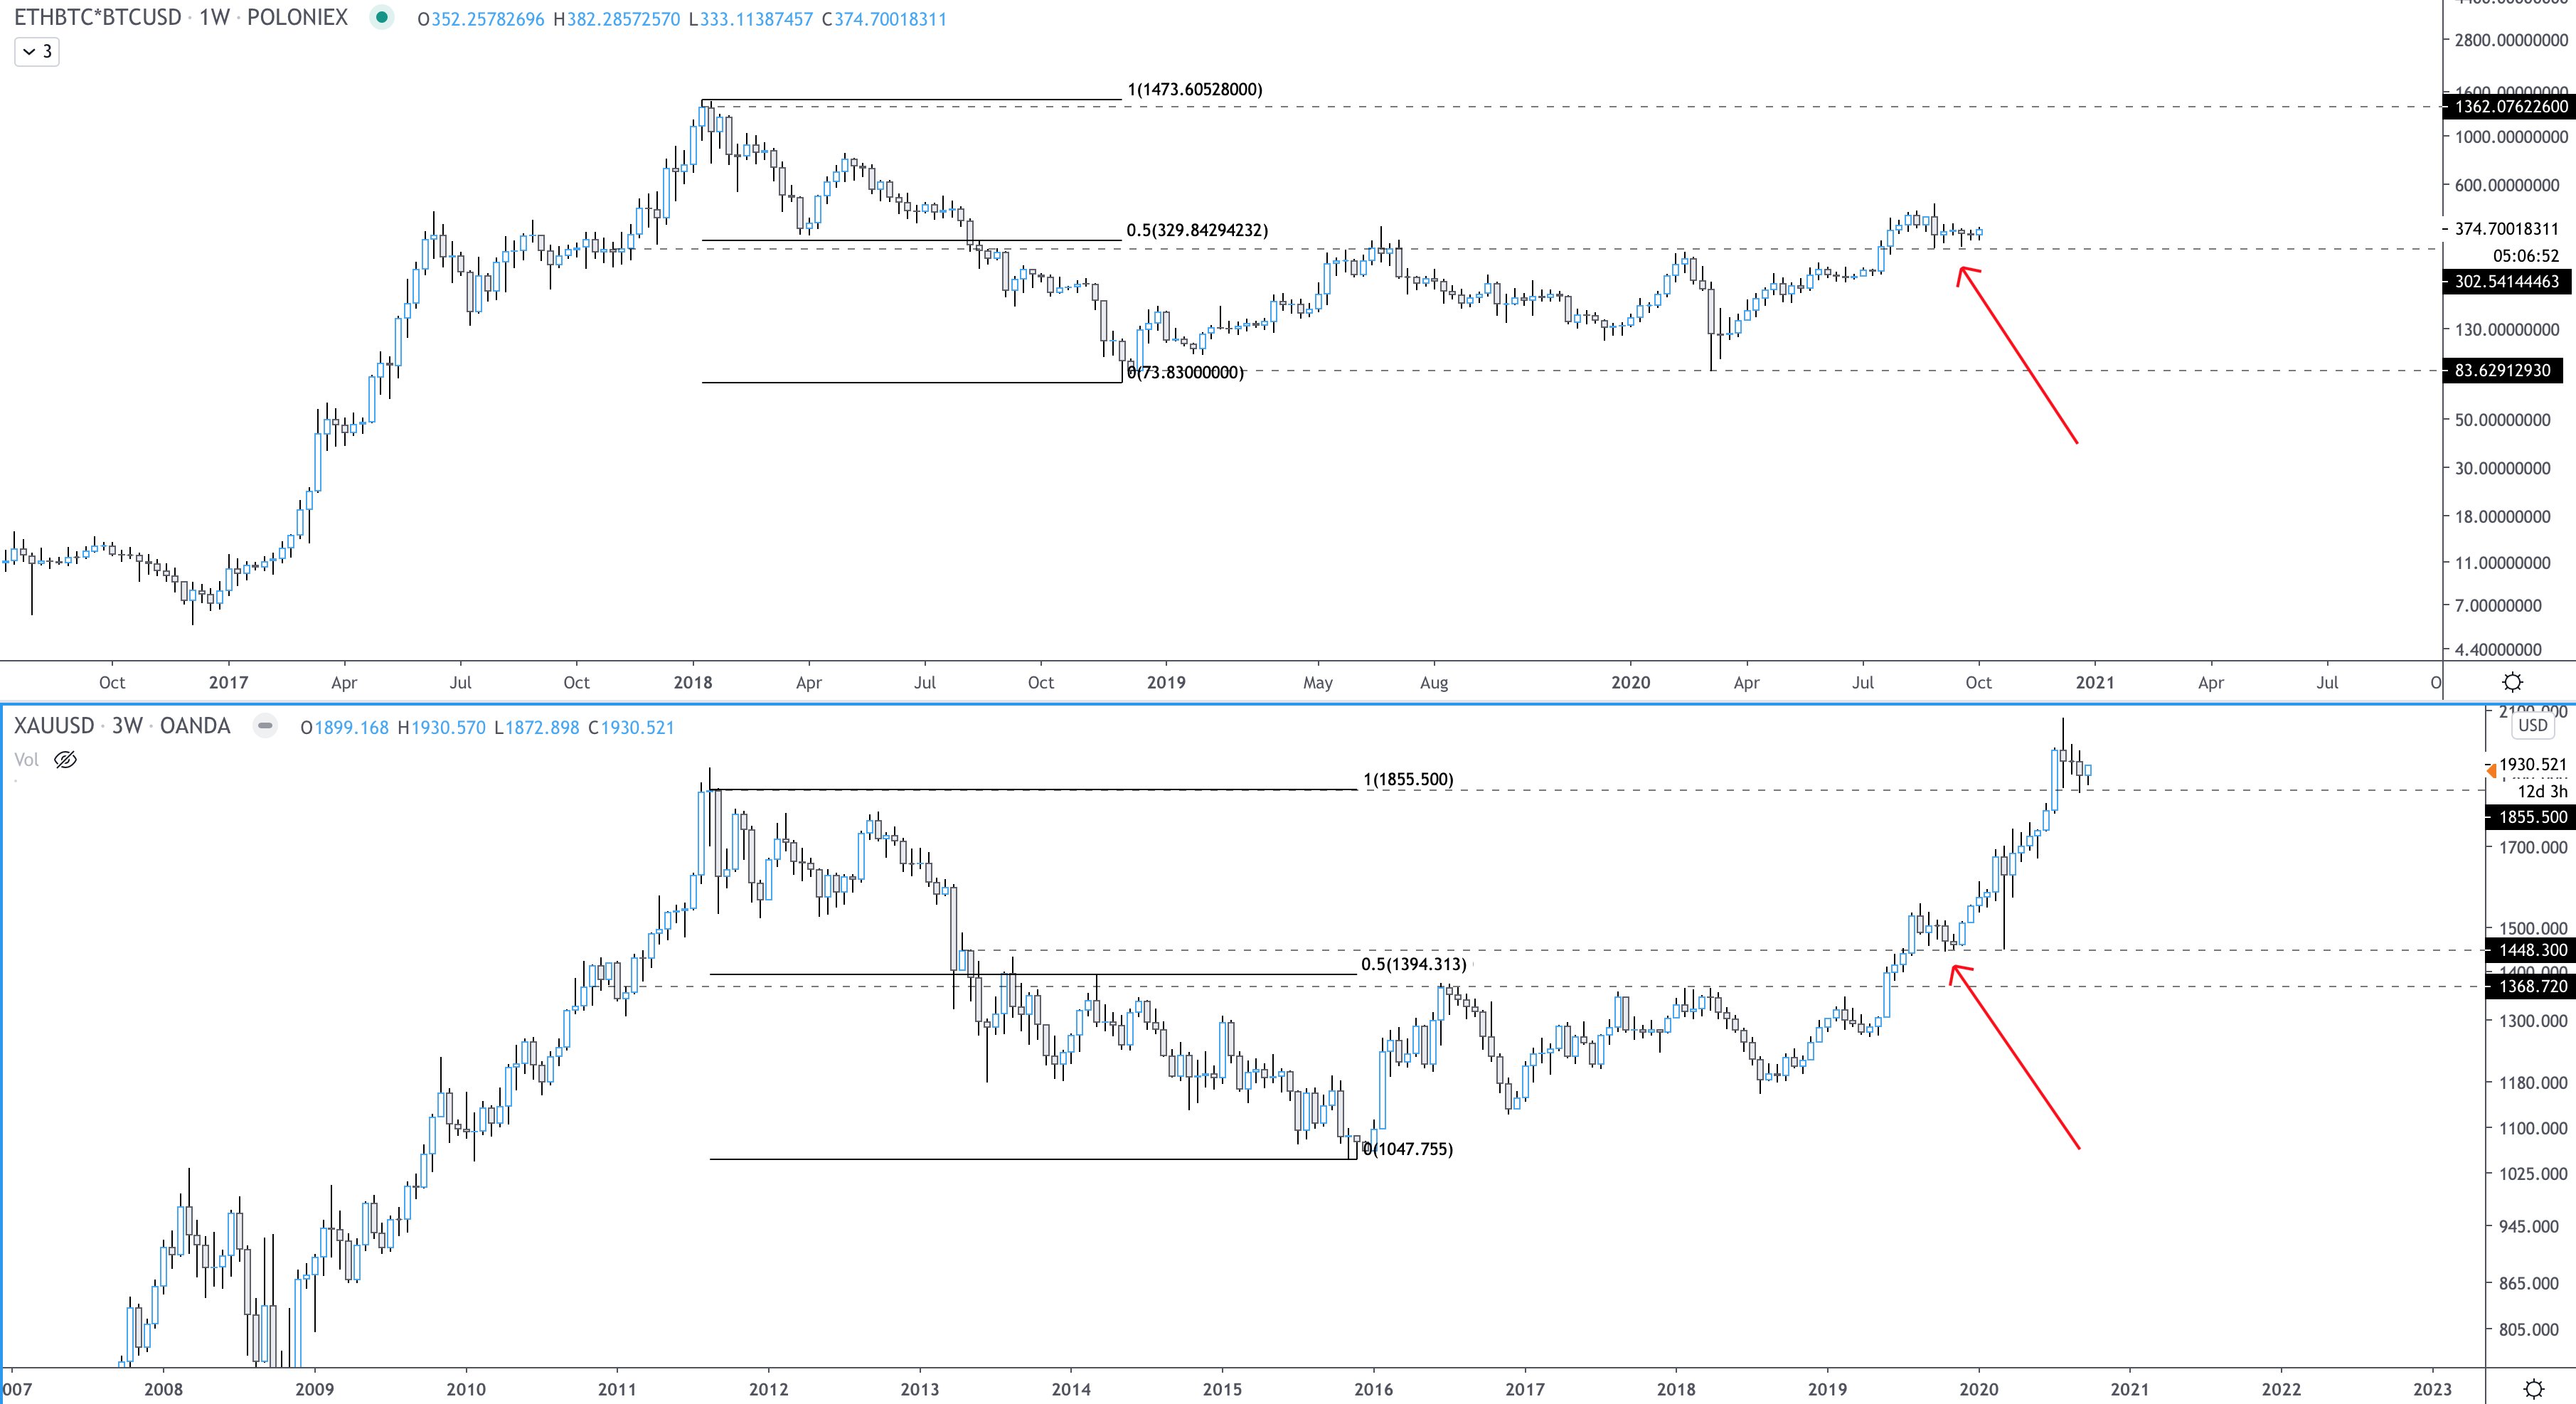
Related Reading: Ethereum Transaction Fees Surge to All-Time Highs After Uniswap Launch Ethereum Is Poised to Move Parabolically, Trader SaysOne crypto-asset analyst recently noted that Ethereum’s macro price action since the start of 2017 looks eerily similar to that of gold from 2007 until now. This fractal analysis predicts that should ETH follow the path gold took, the cryptocurrency will soon enter a parabolic ascent that will bring it towards all-time highs.
The analyst that shared this analysis is the same one that in the middle of March predicted Bitcoin would see a V-shaped reversal and hit $10,000 by May or June. He was proven correct just two months later when the cryptocurrency ended up recovering in the manner he predicted.
Chart of ETH's price action since the start of 2017 with a fractal anaylsis of the price action of gold from 2007 by crypto trader Bitcoin Jack (@BTC_JackSparrw on Twitter). Chart from TradingView.comOf note, he isn’t the only one that thinks that Ethereum will follow such a steep ascent in the coming months and years.
Logan Han, a leading investor on Binance, thinks that there’s a good likelihood that Ethereum also enters a parabolic ascent in the coming months. He also recently shared a chart. That chart also showed that ETH is likely to hit an all-time high, or at least move towards that region, heading into 2021.
Related Reading: MicroStrategy’s Stock Continues to Soar After BTC Purchase Weak On-Chain TrendsWhile Ethereum does have a chart indicating strong growth potential, short-term on-chain trends are not promising for the coin. Santiment, a leading blockchain analytics company, reported this weekend that the number of daily active Ethereum addresses has dropped dramatically since highs in July:
“$ETH’s daily active address metric is still revealing that there is still plenty to be desired since its peak in late July. There has been a decline in unique addresses interacting on the #Ethereum network, particularly since September 17th.”
Chart of ETH's price action over the past few months with an daily active address overlay shared by Santiment, a blockchain analytics company.It appears that this drop is related to high transaction fees, coupled with a decline in the yields/returns offered by the DeFi space.
It is unclear how this on-chain trend will affect Ethereum’s trajectory as depicted by the aforementioned traders.
Related Reading: Tyler Winklevoss: A “Tsunami” of Capital Is Coming For Bitcoin Photo by Cozies Tone on Unsplash Price tags: ethusd, ethbtc Charts from TradingView.com Historically Accurate Analyst Thinks Is Ethereum Poised to Surge Into 2021 origin »Ethereum (ETH) на Currencies.ru
|
|


