Historical Analysis: Bitcoin Looks Extremely Similar to the Start of the $20k Rally

Historical Analysis: Bitcoin Looks Extremely Similar to the Start of the $20k Rally
фото показано с : bitcoinist.com

2020-9-13 03:36

Bitcoin has recently undergone a strong retracement due to a confluence of factors. The cryptocurrency is around 20% below its year-to-date high at $12,500. Some fear that this retracement is the start of a return to a full-blow bear trend. Fortunately for bulls, there is evidence suggesting this is not the case. One crypto trader noted that Bitcoin’s three-week chart looks similar to how it did at the start of the previous macro bull run. This last bull run, which took place from 2015 to 2017, took BTC from the hundreds to $20,000. This positive sentiment is in line with prominent Wall Street investors who think Bitcoin is on the verge of parabolic growth. Bitcoin’s Current Chart Looks Similar to Start of 2015-2017 Rally

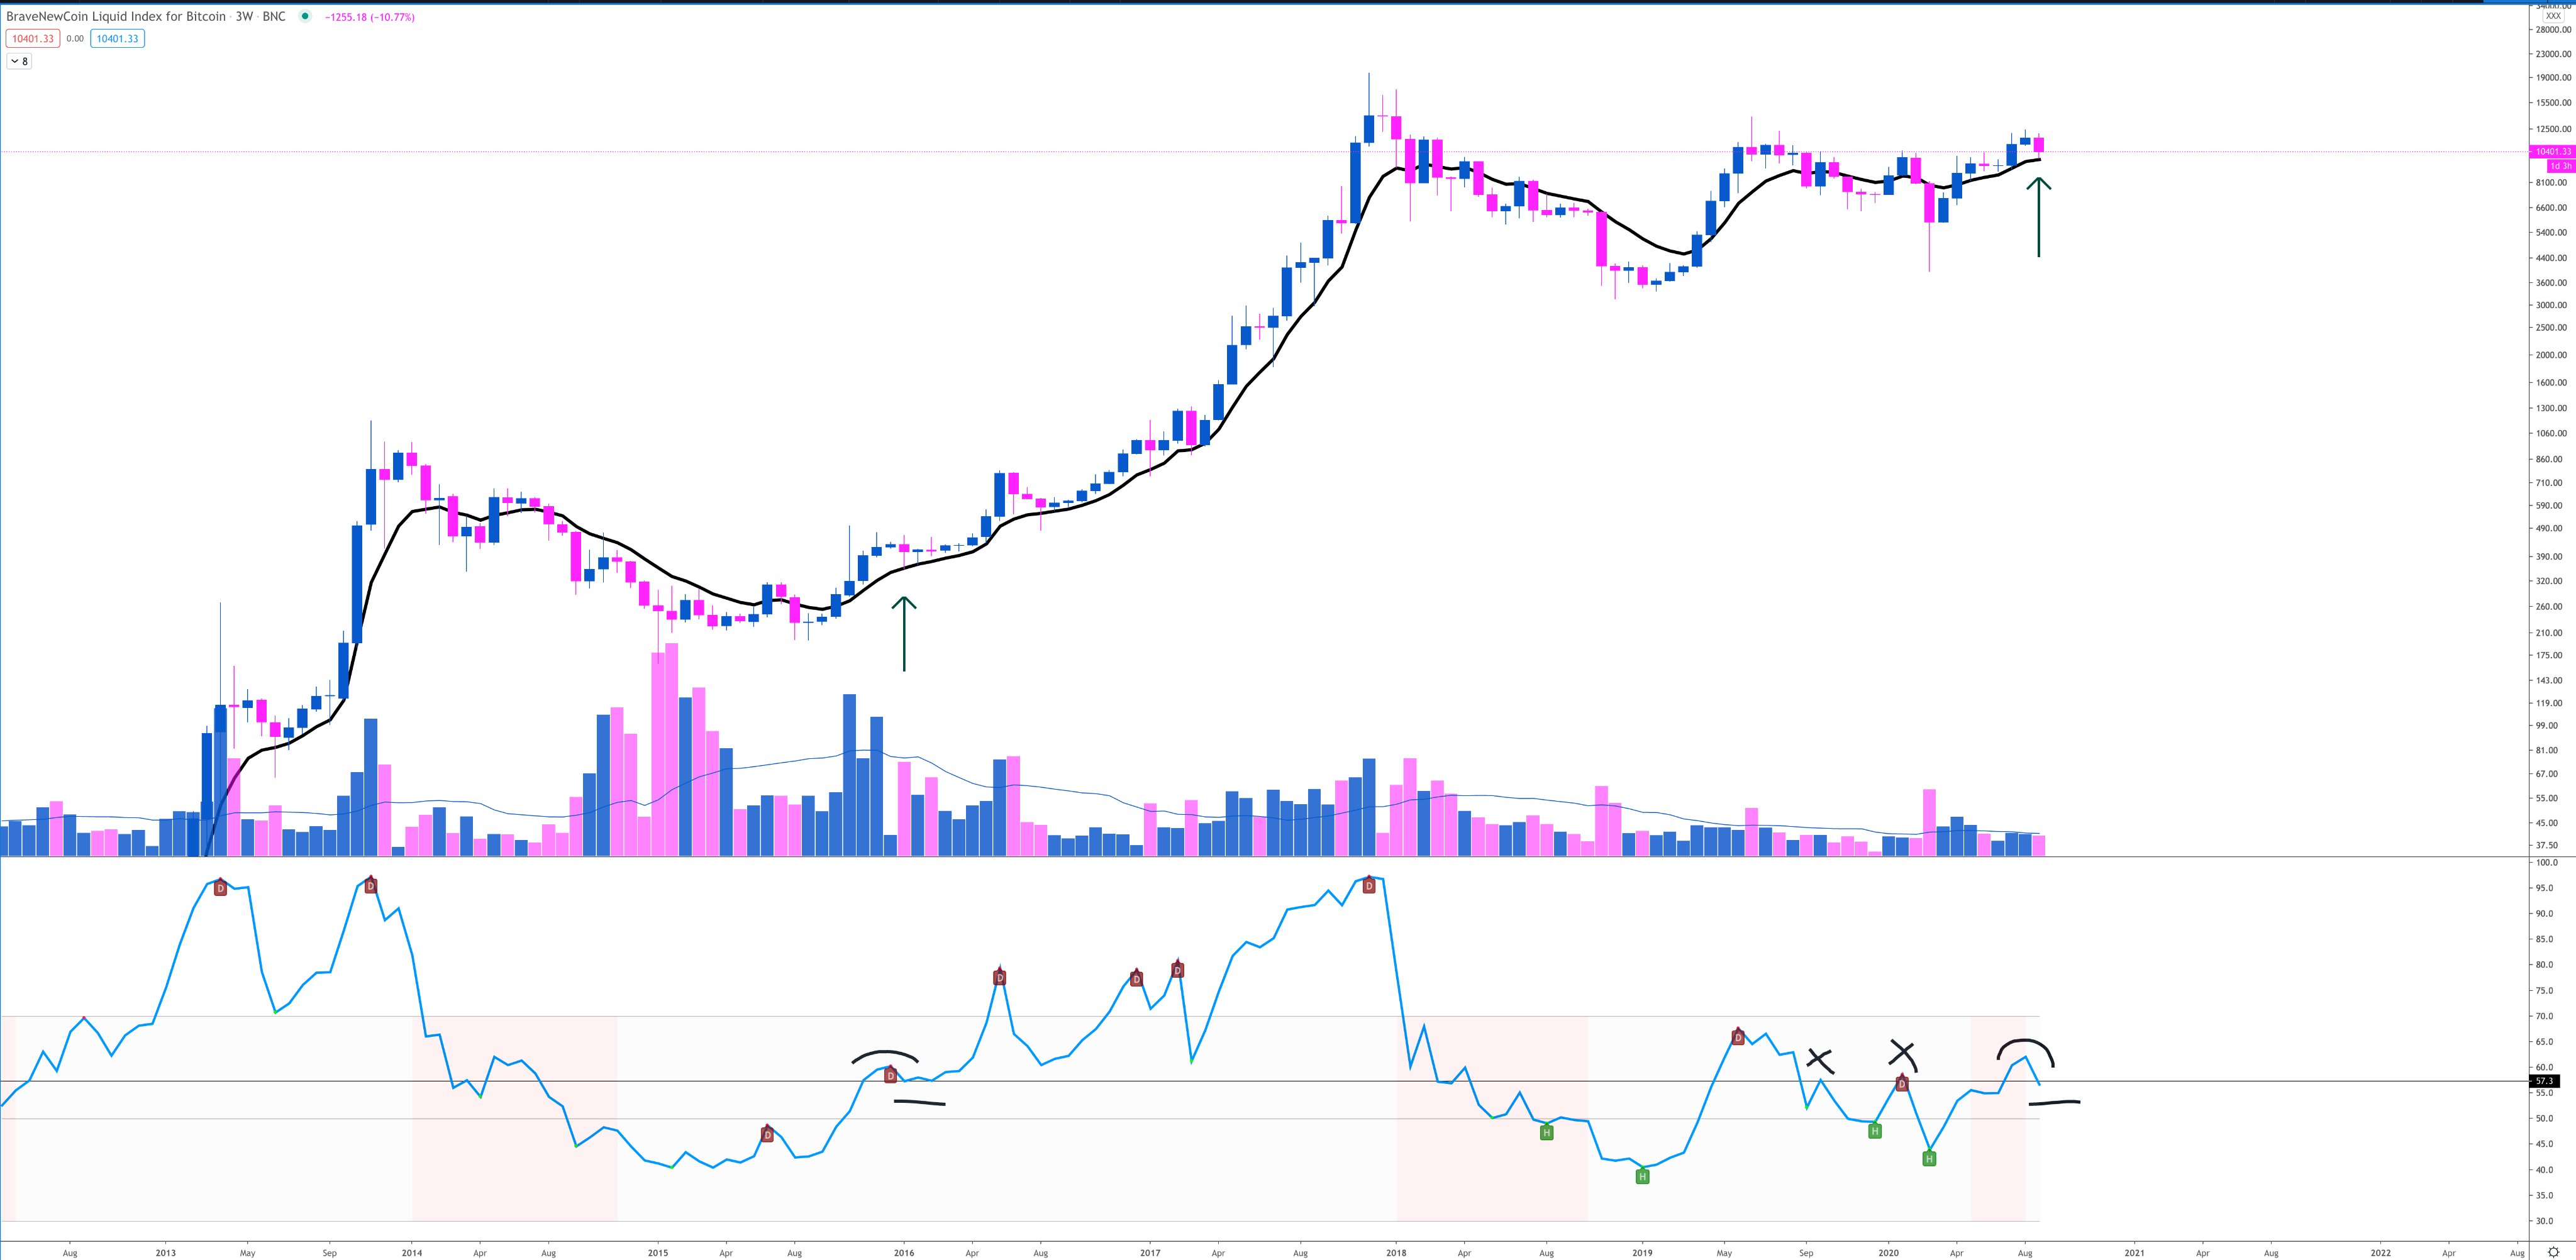
One crypto trader recently noted that Bitcoin’s three-week RSI and 9 exponential moving average looks similar now to what it looked like at the start of the previous bull run.

Should Bitcoin follow the path it took last time the 9 exponential moving average and RSI looked as they did on the three-week chart, an exponential rally is in the works.

Chart of BTC's price action over the past few years with analysis by crypto trader and chartist Polar Hunt (@Polar_Hunt). Chart from TradingView.com Wall Street Bulls Also Think BTC Will Go Exponential

Top Wall Street investors think an exponential rally is poised to begin, corroborating the aforementioned analysis.

Dan Tapiero, co-founder of DTAP Capital and Gold Bullion, recently stated that the cryptocurrency is poised to go exponential:

“Tremendous long term Log Chart of #Bitcoin projects up 5-10x on this run. Just breaking up NOW. Should last a few years as 2.5yr consolidation is fantastic base for catapult up. Break of old highs will have explosive follow through. Time to sit and be patient.”

Chart of BTC's macro price action (Logarithimic chart) by Bitcoin bull and gold investor Dan Tapiero. Chart from Bloomberg

His contemporary, Raoul Pal, formerly of Goldman Sachs, wrote in his own analyses that the cryptocurrency could reach over $100,000 this bull cycle.

Featured Image from Shutterstock Price tags: xbtusd, btcusd, btcusdt Charts from TradingView.com Historical Analysis: Bitcoin Looks Extremely Similar to the Start of the $20k Rally

Similar to Notcoin - TapSwap on Solana Airdrops In 2024

origin »

Startcoin (START) на Currencies.ru

$ 0.0006716 (+0.89%)
Объем 24H $0
Изменеия 24h: 0.53 %, 7d: -1.74 %
Cегодня L: $0.0006683 - H: $0.0006755
Капитализация $0 Rank 8377
Цена в час новости $ 0.0030717 (-78.14%)

retracement bitcoin start high year-to-date below 500

retracement bitcoin → Результатов: 126


Bitcoin Price Prediction Today: Daily (BTC) Value Forecast – May 15

The coin has been overwhelmed by the recent surge in volatility. The 0.236 and 0.382 Fib. retracement levels had been the continuation zone for the bullish trend. BTC/USD Medium-term Trend: Bullish Resistance Levels: $7,750, $8,000, $8,250 Support levels: $7,500, $7,250, $7, 000 Yesterday, May 14, the price of Bitcoin was in a bullish trend zone. […]

2019-5-15 10:31


Bitcoin Price Falls 6% from $7,500; Is BTC Really Vulnerable to Plunge below $6,000?

By CCN: In the past 24 hours, following an intense 25 percent rally within a seven-day span, the bitcoin price has slightly retraced to around $7,000 from its peak at $7,500, by nearly 6 percent. Several technical analysts expected a minor retracement to occur as the bitcoin price surged from $5,000 to $7,500 in a relatively short time frame, demonstrating a parabolic upside movement.

2019-5-13 10:17


Мати Гриспен прогнозирует рост биткоина до $7000

В ближайшее время стоимость Bitcoin легко поднимется до отметки в $7000, уверен старший аналитик eToro Мати Гриспен. Он объяснил свое предположение техническим анализом графика курса первой криптовалюты, пишет РБК Крипто.

2019-4-4 18:41


Фото:

Litecoin Price Analysis: Hitting Major Resistance

The Litecoin (LTC) price continues to surge following an impressive run over the past month — but is it ripe for a pullback? Let’s take a look. Fibonacci Retracement If we take a look at the Fibonacci retracement tool and draw a simple line from the all-time high to its most recent bottom, we can see that the price of Litecoin (LTC) against Bitcoin (BTC) has largely respected each channel while stair-stepping upwards.

2019-3-16 10:30


Фото:

Bitcoin Price Analysis: New High Paves Potential Reversal Setup

After days and days of consolidation, bitcoin finally managed to break a new high for the first time in almost two weeks. This new high, so far, has been short lived, however, as it was almost immediately sold into by eager bears:Figure 1: BTC-USD, 4-Hour Candles, New HighOur current 4-hour candle is seeing a relatively easy retracement after days and days of an upward grind.

2019-3-9 02:08


Newsflash: Sunday Crypto Bloodbath Sees $11 Billion Wipeout Within Minutes

On February 24, following an impressive short-term rally from February 21 to 23, the valuation of the crypto market plunged by $11 billion from $141 billion to $130 billion. Several analysts have suggested that the inability of Bitcoin to break out of the $4,200 mark, a crucial resistance level for the dominant cryptocurrency, led most crypto assets to retrace.

2019-2-24 18:25


Ethereum Price Action – ETH Tests Key Support Near $100 Level

Ethereum is currently testing a support a level just above the key $100 level. $102.7 is coming into play support and price has already tested the level a number of times. The price fell to this level after a brief recovery which took place on Wednesday failed to overcome resistance at an important Fibonacci retracement […] Ethereum Price Action – ETH Tests Key Support Near $100 Level was originally found on Cryptocurrency News | Blockchain News | Bitcoin News | blokt.com.

2019-2-1 19:49