2019-5-24 11:21 |
On Friday, Bitcoin keeps demonstrating bullish signs, analysts believe that a quick recovery after the retracement hints at further price appreciation
Similar to Notcoin - Blum - Airdrops In 2024
2019-5-24 11:21 |
On Friday, Bitcoin keeps demonstrating bullish signs, analysts believe that a quick recovery after the retracement hints at further price appreciation
Similar to Notcoin - Blum - Airdrops In 2024
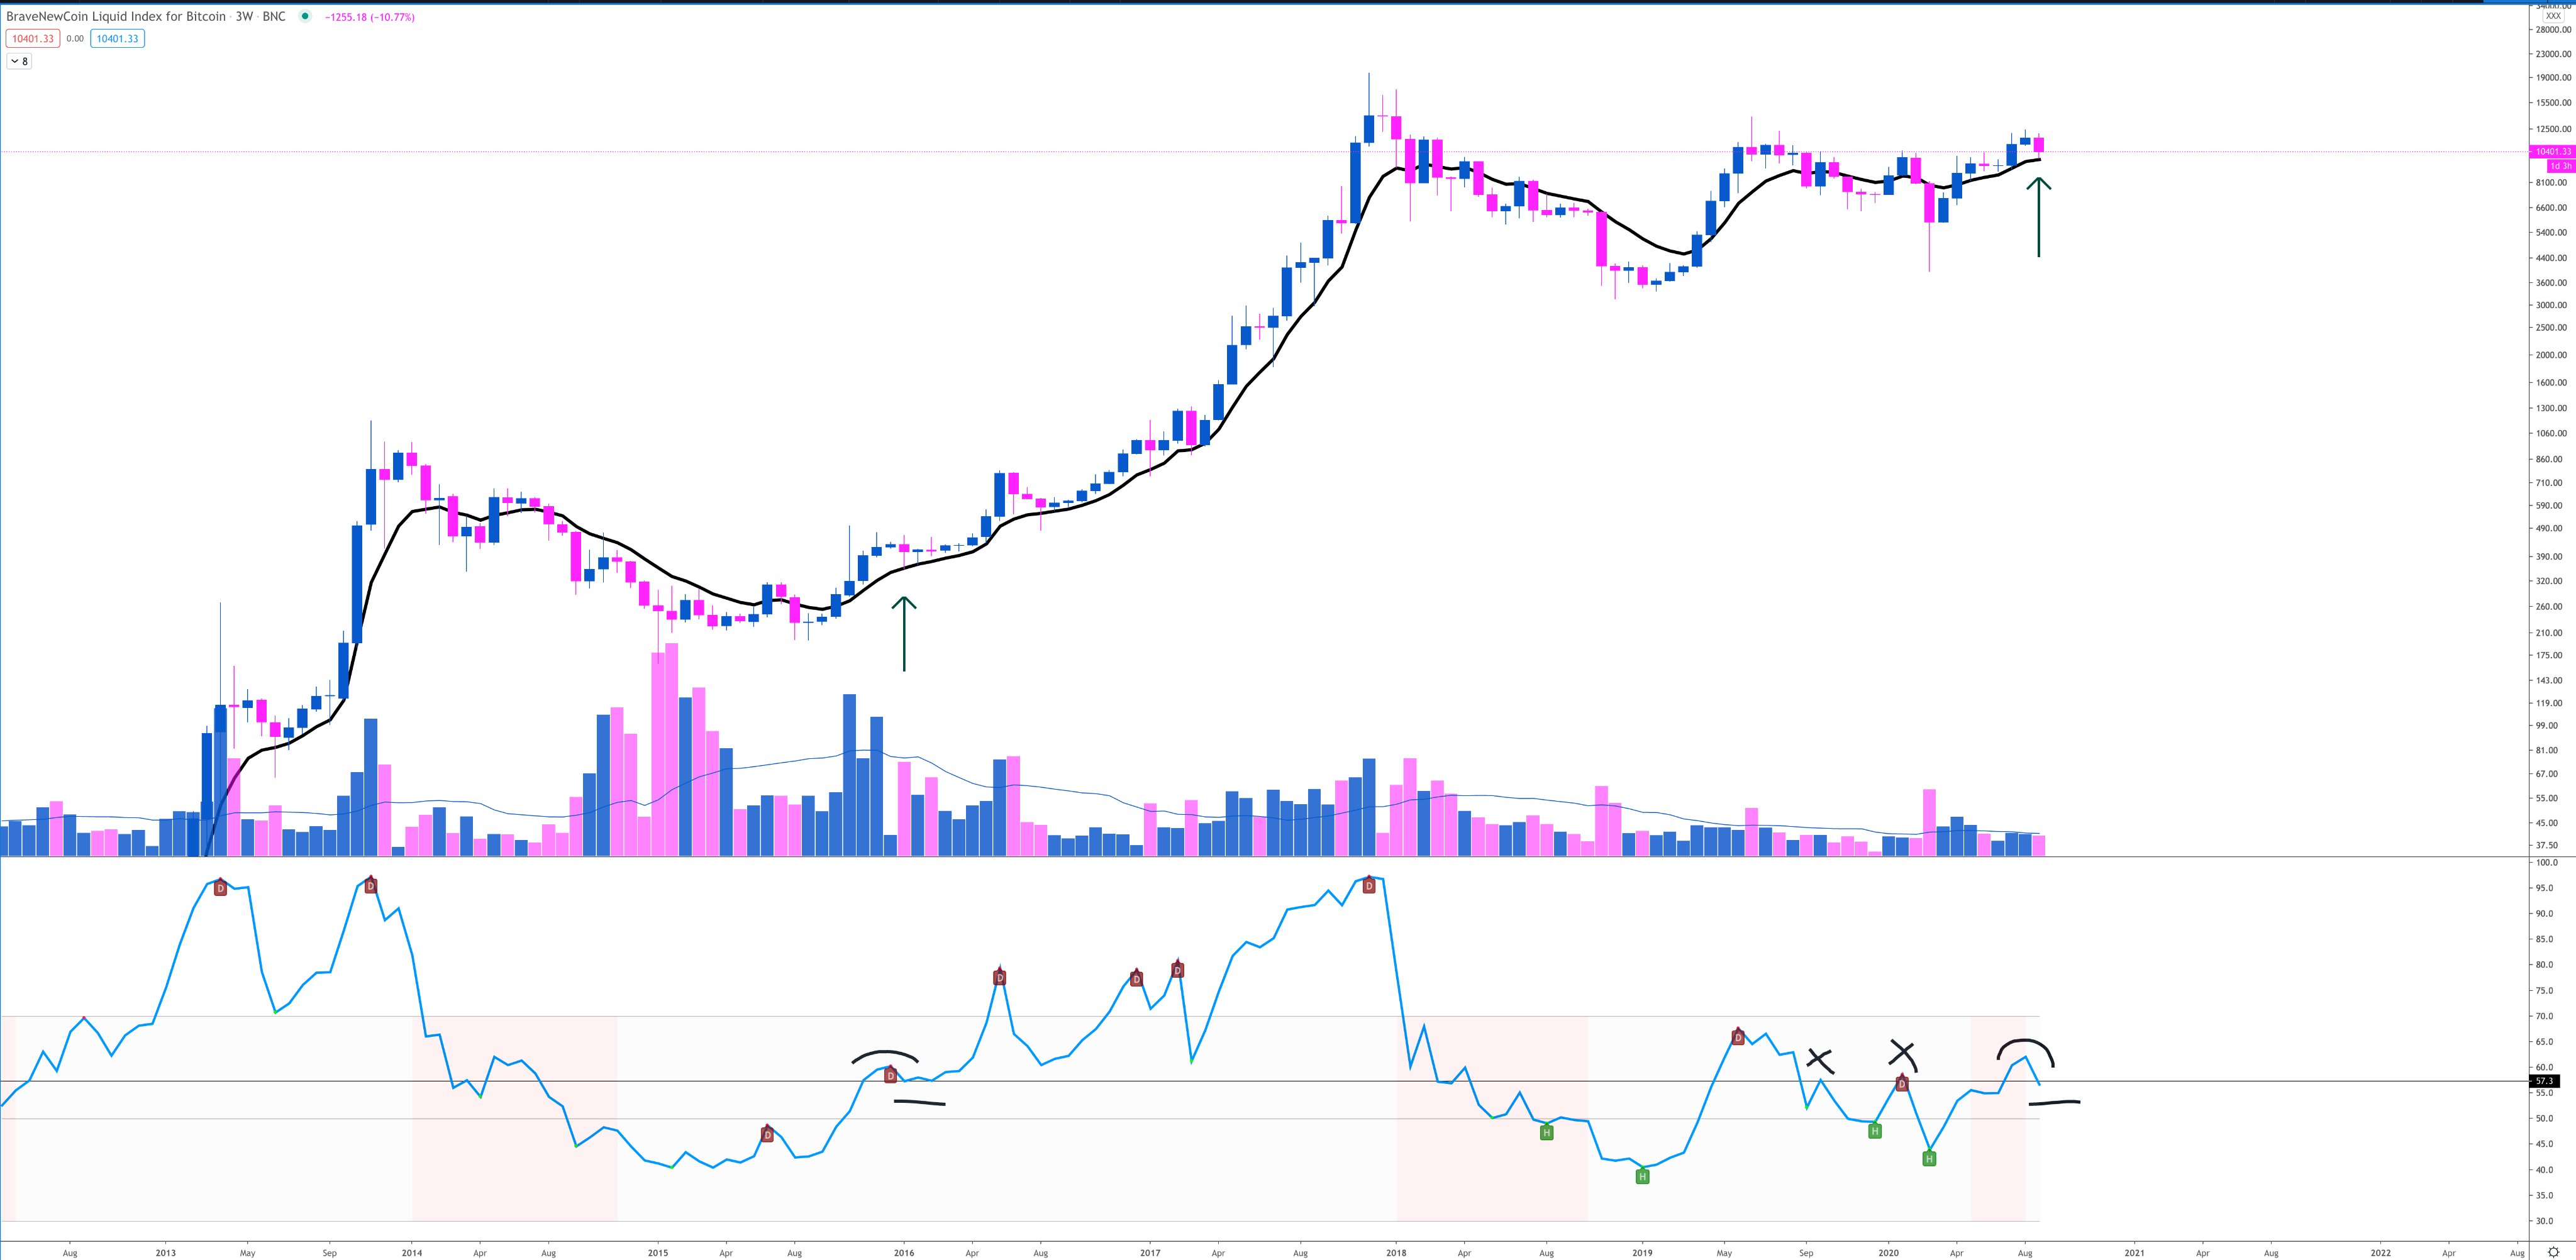
Bitcoin has recently undergone a strong retracement due to a confluence of factors. The cryptocurrency is around 20% below its year-to-date high at $12,500. Some fear that this retracement is the start of a return to a full-blow bear trend.
2020-9-13 03:36 | |
The BTC market is now in a downtrend zone as it fell to the 0. 618 Fib. retracement level. On the downside, if the bears break the $7,800 support level, the market will further depreciates. The price may nosedive to as low as $7,400.
2019-5-23 06:37 | |
From the Fibonacci tool, the downward correction was made to the support of the 0. 382 retracement level. The implication is that the 0. 382 retracement level is likely to hold, and the crypto’s price will rise to revisit the previous highs $8,000 and $8,500.
2019-5-18 09:26 | |
Mati Greenspan has been on a live stream with Bloomberg to provide his explanation of the current surge of Bitcoin price and the retracement that followed
2019-5-17 15:55 | |
On the downside, if the bears break the support of $7,745. 40, the crypto’s price will slide down to the $7,000 price level. The downtrend is likely to continue to the 0. 618 Fib. retracement level which was the previous support level.
2019-5-17 10:46 | |
The crypto’s price is above the 0. 236 and 0. 382 Fibonacci retracement levels which indicate that price is likely to rise. On the upside, if the bulls break the $8,260 resistance level, the market is likely to reach the $8,500 price level.
2019-5-16 10:15 | |
Bitcoin is unstoppable since last few weeks. BAKKT Recent announcement about Bitcoin Futures trading launch in coming months has spiced up the rally. The current rally is slowly turning into a parabolic move.
2019-5-16 23:19 | |
The coin has been overwhelmed by the recent surge in volatility. The 0.236 and 0.382 Fib. retracement levels had been the continuation zone for the bullish trend. BTC/USD Medium-term Trend: Bullish Resistance Levels: $7,750, $8,000, $8,250 Support levels: $7,500, $7,250, $7, 000 Yesterday, May 14, the price of Bitcoin was in a bullish trend zone. […]
2019-5-15 10:31 | |
The recent surge in volatility has made the BTC price to reach the $8,000 price level. More buyers were at the 0. 618 retracement level as the volatility increased to the continuation zone of the 0.
2019-5-14 11:05 | |
By CCN: In the past 24 hours, following an intense 25 percent rally within a seven-day span, the bitcoin price has slightly retraced to around $7,000 from its peak at $7,500, by nearly 6 percent. Several technical analysts expected a minor retracement to occur as the bitcoin price surged from $5,000 to $7,500 in a relatively short time frame, demonstrating a parabolic upside movement.
2019-5-13 10:17 | |
The BTC price fell to the support of the 0. 382 (38. 2%) Fibonacci retracement level. This implies that the BTC price is likely to rise in the continuation zone of the 0. 236 (23. 6%) and 0. 382 (38.
2019-5-13 10:17 | |
The BTC price is currently trading at $6,707. 90 as at the time of writing. The price of Bitcoin is poised to rise because it is in the continuation zone of the Fibonacci retracement levels of 0. 236(23.
2019-5-11 09:39 | |
On the upside, if the 0. 382(38. 2%) retracement level holds, the BTC price will rise to retest the $6,100 price level. On the downside, if the 0. 382(38. 2%) retracement level is broken, the BTC price will be in a downtrend.
2019-5-6 10:48 | |
The crypto's price is in the 0. 236 and 0. 382 Fibonacci retracement levels continuation zone . On the upside, the crypto’s price is likely to rise but may face resistance at the $6,500 price level.
2019-5-4 09:09 | |
Bitcoin (BTC) remains above $5,000 after a few days in which the digital asset fell around 8%. Bitcoin moved from $5,400 down to $4,950 for a short period of time. This was a very important retracement for the crypto space.
2019-4-14 02:46 | |
According to Tyler Jenks, the president of Lucid Investments, bitcoin could fall back to $4,200 in the near future and may eventually drop to $1,000. He said: I have not commented on Bitcoin since we broke up through the $4,000-4,200 resistance zone.
2019-4-13 12:44 | |
Bitcoin price may have surged and held above $5000, but the Bitcoin network has passed milestones of its own this week – one involving a much higher number. 400 Million Quietly Ticks Over As Bitcoin price rose rapidly last week, so did network activity, with volume spiking as traders rushed to take advantage of the new volatility.
2019-4-9 20:00 | |
Litecoin (LTC) continues to lead the altcoin market with a recent push to establish an even higher level of support and sustain trading in a new range against Bitcoin (BTC). Litecoin’s Weekly Chart When trading against Bitcoin (BTC), Litecoin (LTC) has respected each level and zone created by a simple Fibonacci Retracement measure.
2019-4-8 01:30 | |
В ближайшее время стоимость Bitcoin легко поднимется до отметки в $7000, уверен старший аналитик eToro Мати Гриспен. Он объяснил свое предположение техническим анализом графика курса первой криптовалюты, пишет РБК Крипто.
2019-4-4 18:41 | |
Bitcoin is still consolidating after its recent test of the ascending channel resistance, keeping the correction going. Price seems to have bounced off the 38. 2% Fibonacci retracement level but might still be due for a.
2019-3-20 05:16 | |
The Litecoin (LTC) price continues to surge following an impressive run over the past month — but is it ripe for a pullback? Let’s take a look. Fibonacci Retracement If we take a look at the Fibonacci retracement tool and draw a simple line from the all-time high to its most recent bottom, we can see that the price of Litecoin (LTC) against Bitcoin (BTC) has largely respected each channel while stair-stepping upwards.
2019-3-16 10:30 | |
After days and days of consolidation, bitcoin finally managed to break a new high for the first time in almost two weeks. This new high, so far, has been short lived, however, as it was almost immediately sold into by eager bears:Figure 1: BTC-USD, 4-Hour Candles, New HighOur current 4-hour candle is seeing a relatively easy retracement after days and days of an upward grind.
2019-3-9 02:08 | |
Following Sunday’s sudden rally and retracement, most leading crypto assets have produced sideways consolidation just below the support ranges established during the previous week. The major exceptions to the trend are XRP and ONT, both of which appear to have held above last week’s support zones.
2019-2-26 14:55 | |
On February 24, following an impressive short-term rally from February 21 to 23, the valuation of the crypto market plunged by $11 billion from $141 billion to $130 billion. Several analysts have suggested that the inability of Bitcoin to break out of the $4,200 mark, a crucial resistance level for the dominant cryptocurrency, led most crypto assets to retrace.
2019-2-24 18:25 | |
Bitcoin is still on a tear but could use a pullback in order to sustain a climb. Price hit resistance close to the $4,100 mark and appears ready for a retracement to the Fib levels... The post Bitcoin (BTC) Price Analysis: Short-Term Bullish Pullback Levels appeared first on Ethereum World News.
2019-2-20 06:42 | |
Many cryptocurrencies rose and fell during the 2017 bull market and subsequent year of bearish retracement. While the top four crypto assets by market cap have remained the same over the last two years, more than half of the leading markets as of Feb.
2019-2-18 18:55 | |
Bitcoin price finally broke out of a ten day consolidation above $3,500 this morning, having held the 38. 2% retracement level for the majority of last week. We take a look at what this means going into the week.
2019-2-18 15:00 | |
A bullish surge last week resulted in Ethereum overtaking XRP to become the largest altcoin by market cap. The price has since been consolidating at the 50% retracement level between the December low and the January high.
2019-2-14 19:08 | |
Long-Term Outlook A look at the Weekly chart for Litecoin shows that the price of LTC/USD has found resistance at the major resistance area formed by previous support near $50, and started a small retracement.
2019-2-14 14:09 | |
Bitcoin finally broke out of its downtrend as it surged above the descending trend line to signal that a reversal is due. However, price is turning at the $3,800 resistance so a correction to the broken trend line might take place first.
2019-2-12 07:14 | |
Litecoin underwent a huge surge last week. Movements in Litecoin preceded bullish movements across the rest of the market with Litecoin often acting as a leading indicator for movements in other top cryptocurrencies.
2019-2-11 18:49 | |
Bitcoin seems to have completed its pullback to the area of interest at the $3,460 area and could be ready to resume its slide. Price might aim for the Fibonacci retracement levels next. The 100 SMA is still below the longer-term 200 SMA to indicate that the path of least resistance is to the downside.
2019-2-8 06:53 | |
IOTA is bouncing from a key support level today after recording a significant loss during yesterday’s price action. Data from Messari shows IOTA outperforming the top 10 cryptocurrencies after recording a 5.
2019-2-7 18:49 | |
Bitcoin recently broke below a short-term rising trend line to indicate that a downtrend is due. Price bounced off the $3,400 mark and might be heading for a pullback to the nearby Fibonacci retracement levels.
2019-2-7 03:57 | |
Litecoin has been the top performing major cryptocurrency over the past seven days. Data from Messari show Litecoin increasing 10% in price over the past seven days. If Fibonacci retracement levels are drawn from the December low to the January, we can see that price has been meeting resistance at the 0.
2019-2-5 18:24 | |
Bitcoin is trending lower on its 1-hour time frame and seems to be bouncing off the mid-channel area of interest on the descending channel. However, price has yet to make new lows or test the latest ones, so a larger pullback might still be due.
2019-2-4 07:06 | |
Ethereum has underperformed other top cryptocurrencies this week. The week started with a bearish drop that took place across the market and brought the price of Ethereum below a key level. Prices started the week dropping below a key Fibonacci retracement level.
2019-2-3 18:44 | |
Ethereum is currently testing a support a level just above the key $100 level. $102.7 is coming into play support and price has already tested the level a number of times. The price fell to this level after a brief recovery which took place on Wednesday failed to overcome resistance at an important Fibonacci retracement […] Ethereum Price Action – ETH Tests Key Support Near $100 Level was originally found on Cryptocurrency News | Blockchain News | Bitcoin News | blokt.com.
2019-2-1 19:49 | |
Bitcoin found support at the bottom of its descending channel on the 1-hour time frame and looks due for a pullback to the top. Applying the Fibonacci retracement tool shows the next potential resistance levels.
2019-1-29 04:16 | |
If we draw Fibonacci retracements from the December low to the January high of both Ethereum and Litecoin, we see similar price action taking place. The majority of trading during the week in both Ethereum and Litecoin took place at the 50% retracement level.
2019-1-21 19:34 | |
Ethereum hugely outperformed from mid- December to early January but has since been underperforming other major cryptocurrencies. If we draw Fibonacci retracement levels from the December low to the January, the price seems to be finding support at key levels between points.
2019-1-18 19:54 | |
The cryptocurrency markets have produced a slight retracement in response to bitcoin core (BTC) testing a long-term descending trendline dating back to December 2017’s record highs. The dip has seen bitcoin cash (BCH) slip back below $150, and BTC fail to hold above $4,000.
2019-1-10 19:00 | |
After a bullish start to 2019, the cryptocurrency markets are undergoing a small retracement over the past two days. Ethereum has had a particularly bullish end to 2018 and a bullish start to 2019 as it reclaimed its position as the largest altcoin by market cap by overtaking Ripple’s XRP.
2019-1-4 19:08 | |
A look at the Weekly chart for Tron (TRX) shows that price has been following a falling support line. The RSI is 40, indicating neither overbought nor oversold conditions. The MACD recently made a bullish cross (yellow arrow) and is seemingly headed upward.
2018-12-28 14:49 | |
Bitcoin recently made a strong rally, enough to break past the neckline of its double bottom at $3,600 to $3,700. This confirms that an uptrend is underway, but only if buyers can be able to keep price above the area of interest.
2018-12-20 04:06 | |
Earlier this week, bitcoin enjoyed a strong and quick rally, spanning all the way from the low $3,100s to the upper $3,900s — in other words, a move that previously took the market weeks to make, this time took place in just a few short days.
2018-12-20 02:21 | |
Bitcoin is still gaining traction on its bounce and breakout from a short-term falling wedge pattern. This could put it on track for a major pullback on its longer-term slide, possibly even starting a reversal.
2018-12-19 07:14 | |
Bitcoin is still trending lower inside its descending channel that has been holding on so far this month. Price bounced off the bottom and has pulled up to the top, which is holding as resistance once more.
2018-12-17 07:28 | |
Bitcoin is still trending lower inside a descending channel on the 1-hour chart but is currently testing the resistance to attempt another break. However this lines up with an area of interest or former support that might now hold as a ceiling.
2018-12-10 05:02 | |