2022-2-9 09:19 |
The second-largest crypto has been on a downward trend in January. However, the weekend brought a different case. ETH opened the market on Friday at 2681.06 and closed at 2983.59. On Monday, Ethereum was looking at closing at 3142.47. Looking at the charts on trading view, here is the likelihood of the trend.
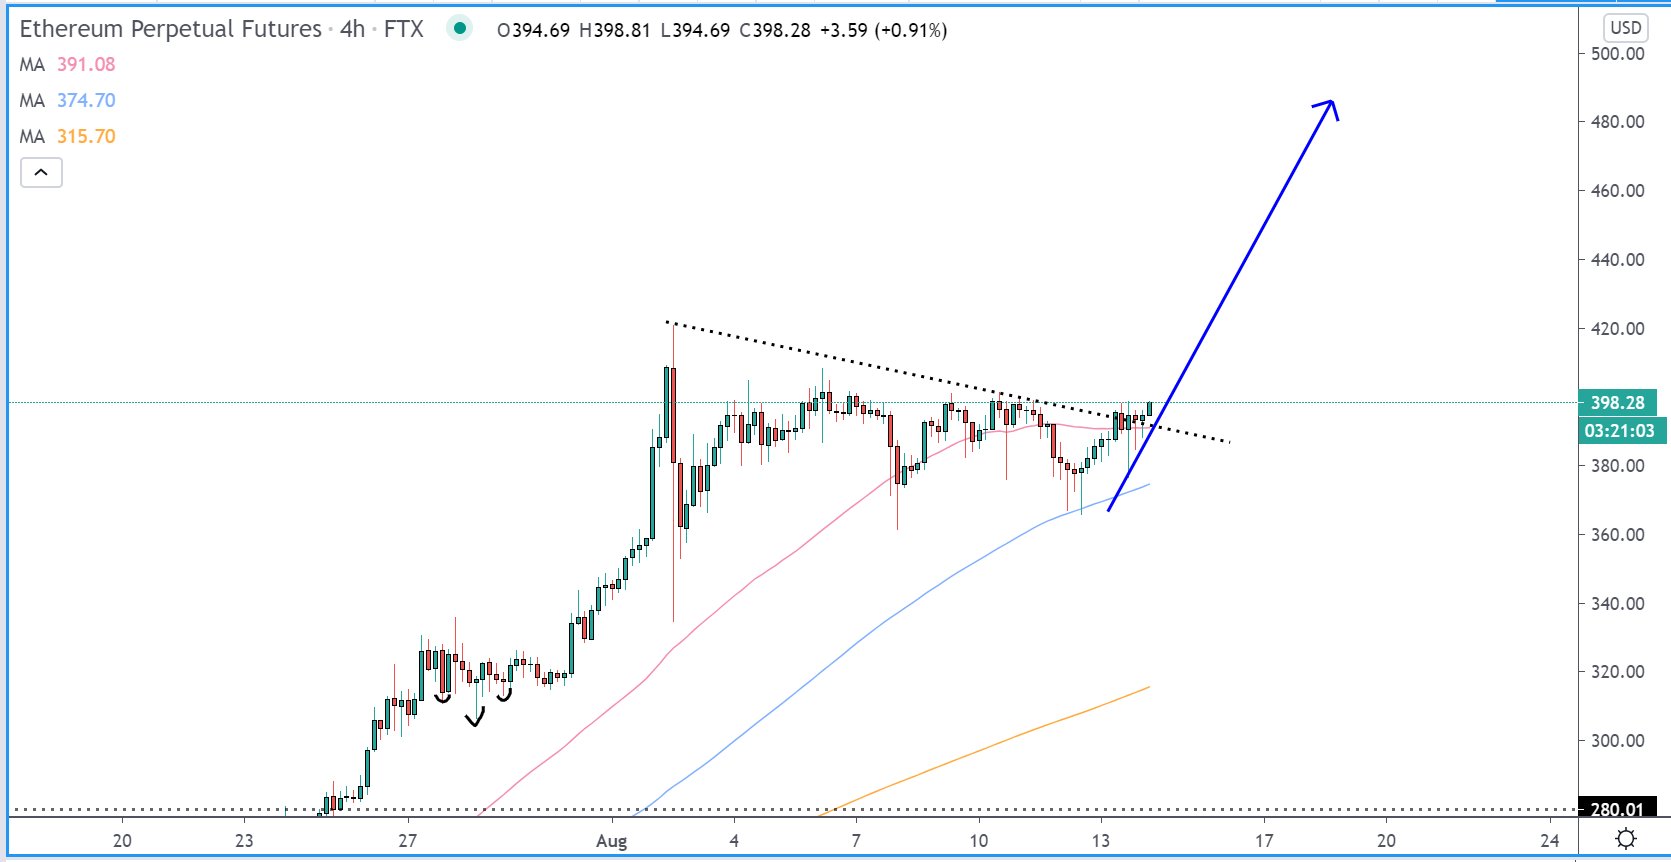
ETHEREUM ANALYSIS (ETH/USD)The ETH/USD chart has been bearish for the last two months. The 4h timeframe shows that the price is retracing towards the last demand zone. The price has not hit the equilibrium on the demand zone, so buyers are still waiting for it to deep before the move turns into a serious bullish one. Players are waiting to sell at the price that occurred on 24th Jan which is around 2158.46
However, Wednesdays are the days moves get to show faces. Look at the 15m time frame; we wait for a retracement to 3171.11 then enter the market to 3061.36, but you can take profit anywhere you feel safe.
Please remember that ETH/USD has been bullish. Lower time frames may tell you something different. Please take note of the red candles; they are longer than the greens. The price is consolidating on a lower time frame but is not yet bullish.
Let’s also consider the support and resistance levels. The three support levels are 3893, 3365, and 2954. The first support level is weak, while the other two are moderate. This means that the moves will not be massive, and breaking the average support levels is likely impossible. However, if you go back to the demand equilibrium price, any fundamental negative news about Ethereum may break the lowest support level.
The resistance levels are 3677, 4025, and 4380. All the resistance levels for ETH are weak but won’t break. Resistance levels cannot break because ETH needs huge buyers and the buyers are not available.
Charts: Tradingview
The post Ethereum Price Analysis for February 8th – Resistance Levels Are Weak but Won’t Break appeared first on NullTX.
origin »Bitcoin price in Telegram @btc_price_every_hour
Ethereum (ETH) на Currencies.ru
|
|


