2024-12-2 12:30 |
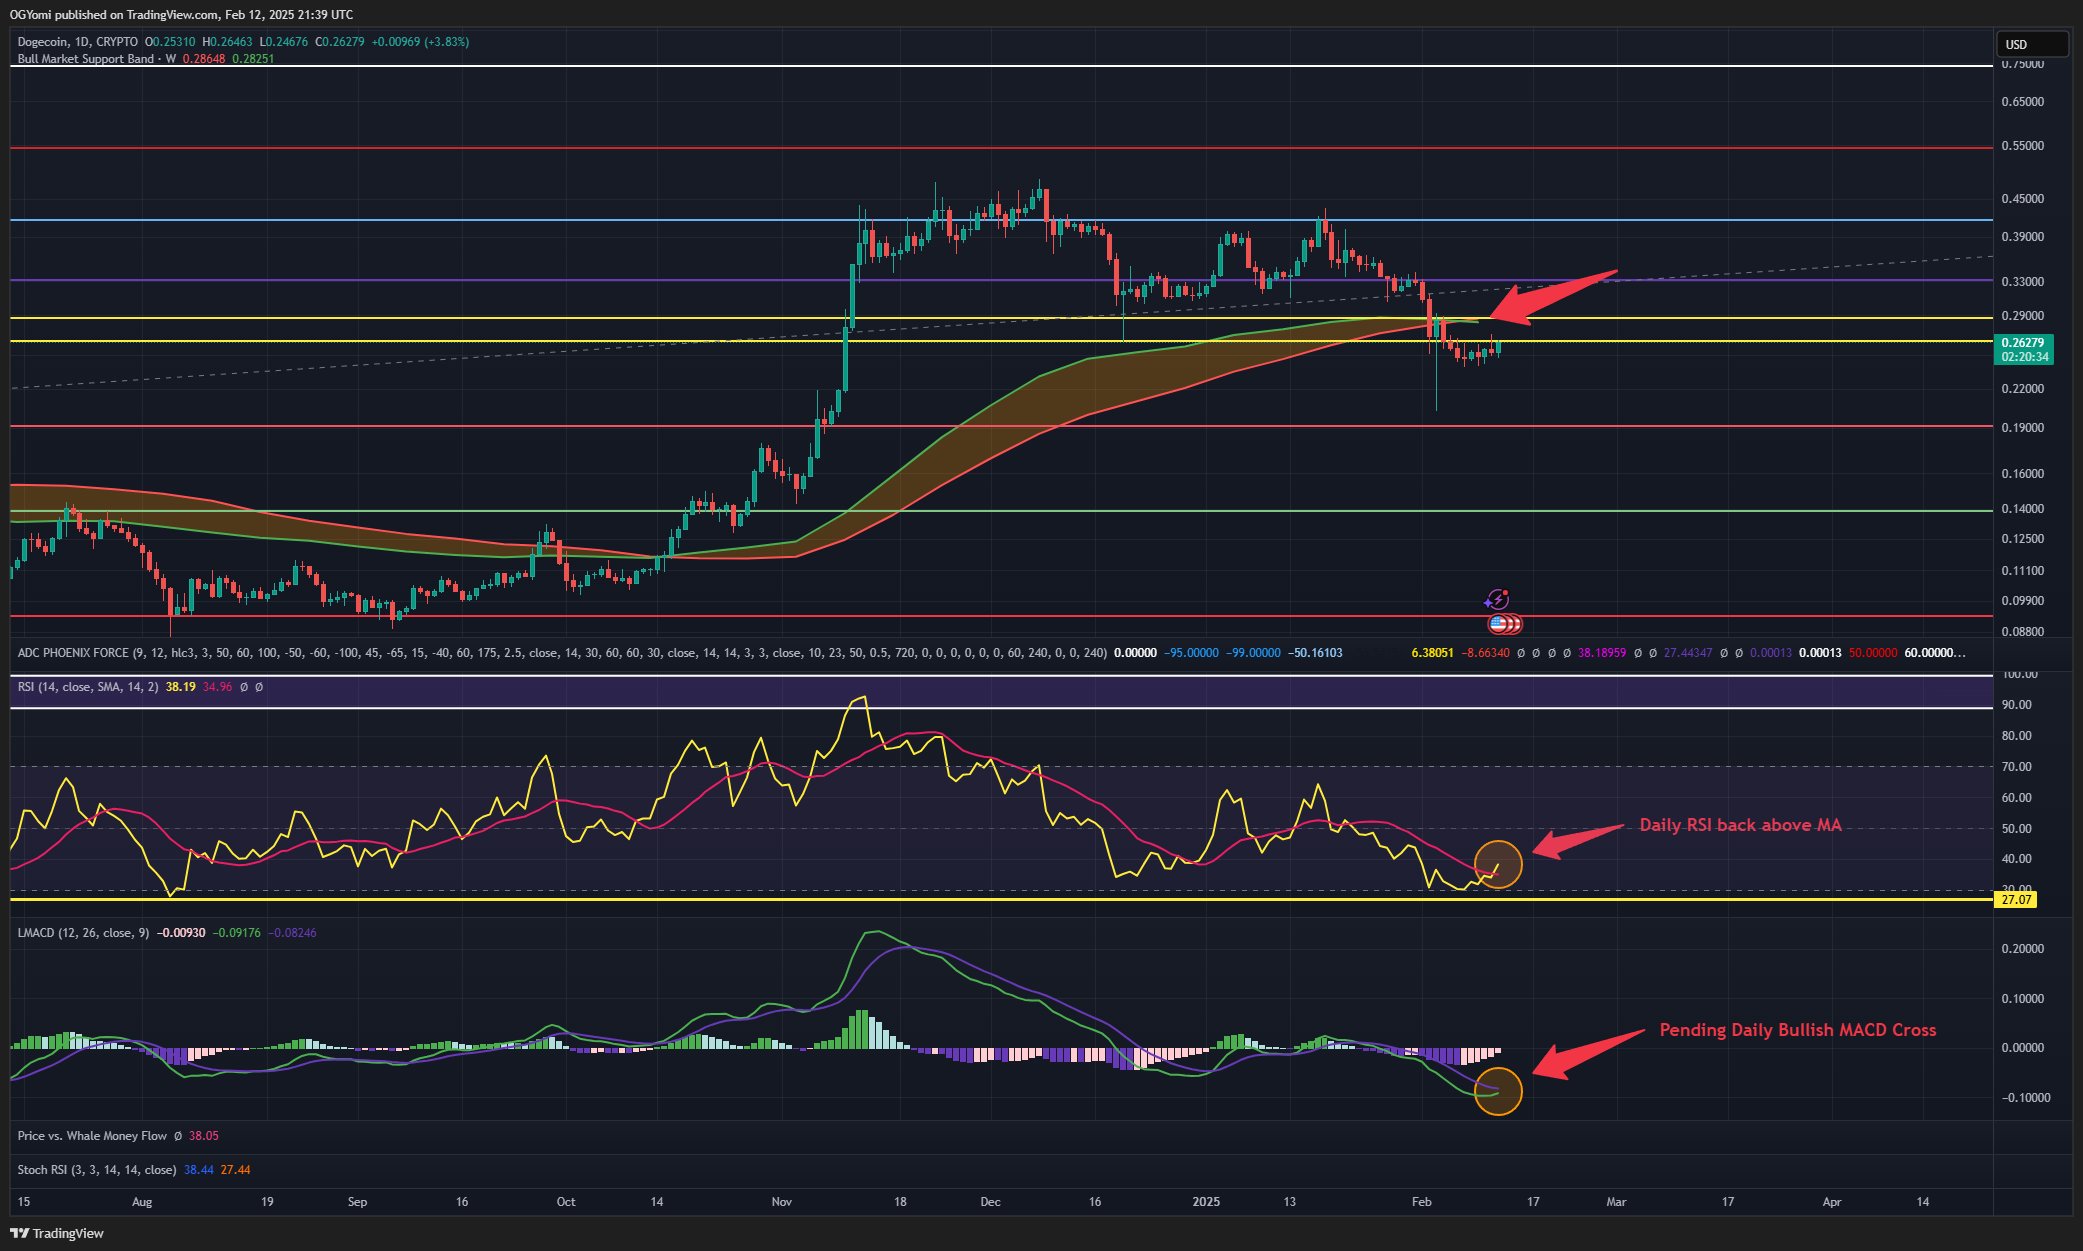
After staging a massive rally, the Dogecoin price is currently in a consolidation phase. And this is also reflected in the technical indicators. Crypto analyst Kevin (@Kev_Capital_TA) is warning of a potential sell indicator. In his latest update on X, Kevin shared a weekly DOGE/USDT chart and outlined technical signs that traders should monitor closely.
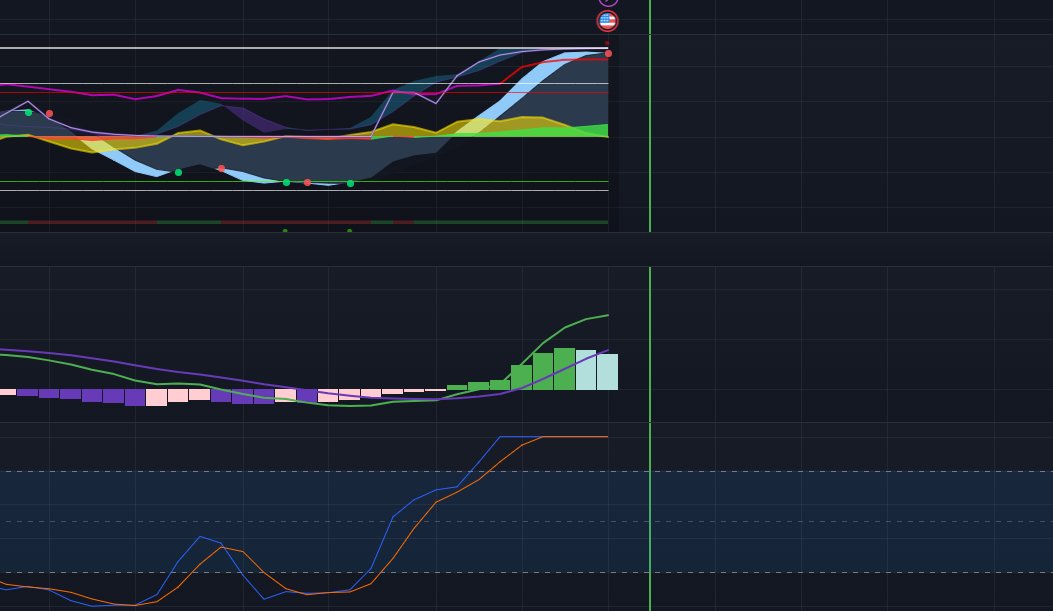
Dogecoin Price AnalysisKevin highlighted that Dogecoin is “printing a sell signal on the weekly time frame with the red dot appearing,” cautioning that this signal requires confirmation over the next week to solidify its validity. He identified a convergence of three strong technical indicators, including a declining Moving Average Convergence Divergence (MACD) and a Stochastic Relative Strength Index (Stoch RSI) that has “topped out waiting for a bear cross.”
These indicators collectively suggest that a potential downside may be imminent. However, Kevin balanced this with the observation that “price action still looks bullish and money flow is also bullish,” indicating that these factors currently outweigh the bearish signals.
Despite the long-term sell signals, Kevin remains open to the possibility of continued bullish momentum in the short term. He noted that Dogecoin has “close[d] its highest monthly candle body close of all time,” marking a significant milestone while acknowledging that “downside is still a risk.”
Looking ahead, Kevin pointed to the importance of a key resistance level, stating, “Until we break $0.60 cents cleanly then there’s nothing to really be excited about,” in reference to his weekly chart that includes Fibonacci price levels extending to $1.
Moreover, Kevin is closely looking at macroeconomic factors that could influence Dogecoin’s performance. He indicated that an “altcoin season” could serve as a catalyst for DOGE’s continued strength, contingent upon Bitcoin’s dominance falling below the 55% level. “If BTC Dominance breaks the 55% level cleanly you will get your #ALTSEASON folks,” he explained.
Additionally, Kevin shared his strategy regarding long-term moving averages, stating, “When these two long term moving averages cross on Dogecoin I will be selling a large piece of my bag. They have called the top successfully on DOGE multiple times. They are moving up fast!”
Notably, the crypto analyst is referring to the Pi Cycle Top Indicator for Dogecoin, a tool traditionally used for Bitcoin (BTC). This indicator relies on the crossing of two moving averages—the 111-day and the 350-day multiplied by two—to signal potential market peaks.
Last week, Kevin revealed, “One of my secret indicators for Dogecoin that is traditionally only supposed to work for BTC is the Pi Cycle tops indicator. It has accurately called every DOGE cycle top and bottom over each of its cycles. When the two moving averages cross along with Monthly RSI being at a certain level that’s when I plan on taking significant portions out of the market.”
At press time, DOGE traded at $0.41.
origin »Bitcoin price in Telegram @btc_price_every_hour
Emerald Crypto (EMD) на Currencies.ru
|
|


