2020-9-3 17:58 |
Coinspeaker
Crypto Price Analysis September 2: BTC, ETH, LTC, BCH, EOS
Dmitriy Gurkovskiy, a senior analyst at foreign exchange broker RoboForex, provides his vision of the possible tendencies in price changes for Bitcoin as well as for other major cryptos.
The Ethereum is ahead of the others that do not hurry to renew the highs. Moreover, on D1s of such cryptocurrencies as the Litecoin or Eos, reversal patterns are forming, promising a decline, and if the buyers fail to keep the nearest support levels, the crypto market may experience another serious drawdown. On the Bitcoin chart, there is a similar structure – a Triangle pattern. Here, the bulls are so unwilling to let the price go above $12,000 that it breaks away the support level and secures under $11,055, which may entail falling to $10,000 and lower, to $8,825.
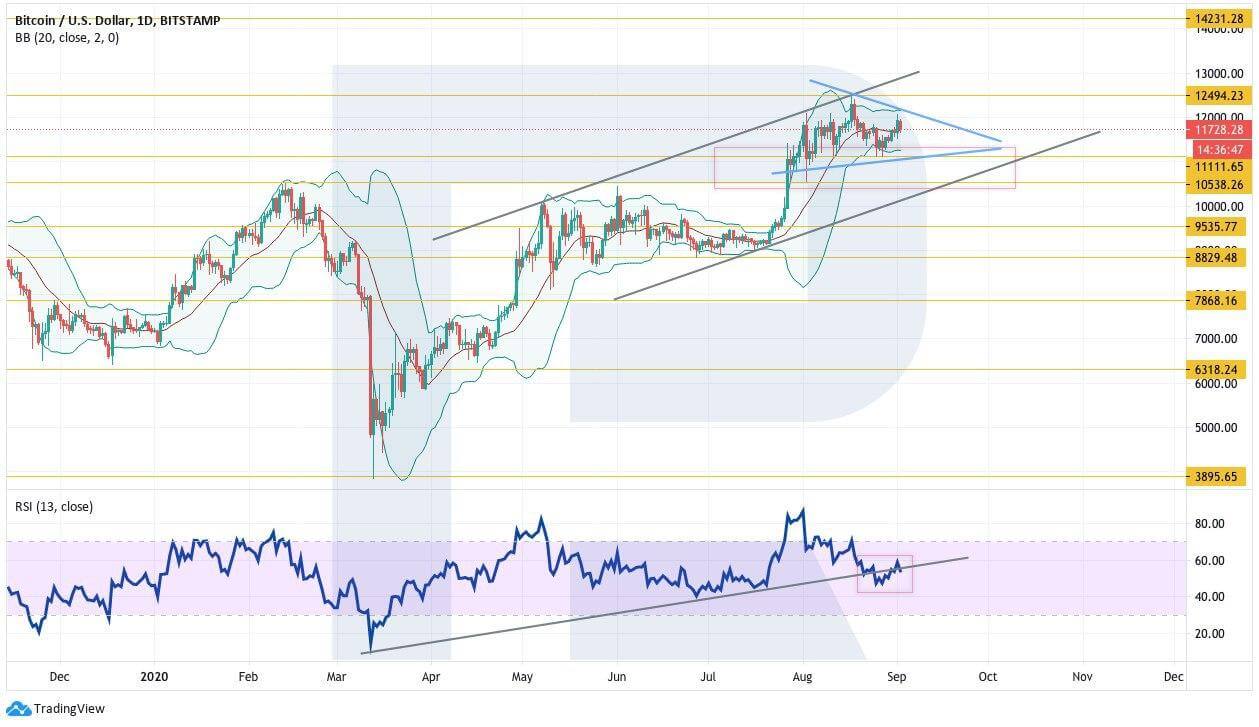
BitcoinOn D1, the Bitcoin is correcting by a Triangle pattern; if the upper border of the pattern is broken away, and the price secures above $12,495, we may expect the asset to grow to $14,230. Another confirmation of this scenario is the return of the RSI values above the support line. The scenario may no longer be valid if the lower border of the pattern is broken away, and the price secures under $11,055, in which case the price may correct significantly to $8,830.
Photo: RoboForex / TradingView
On H4, the price managed to bounce off the support level confidently. A strong signal confirming the growth would be a breakaway of the resistance line on the RSI; however, for now, there was just a bounce off it. The continuation of the bullish trend may also be confirmed by a breakaway of the upper border of the Triangle; for this, the price only needs to secure above $12,065. This is a strong resistance area: as you may see, the price pushes off this level for the third time, which also indicates that sellers are still putting pressure on it.
Photo: RoboForex / TradingView
EthereumOn D1, the Ethereum quotations keep growing actively. The price bounced off the lower border of the Bollinger Bands indicator and easily broke its upper border, demonstrating an uptrend. Another bounce off the support line on the RSI supports further growths of the asset. The aim of the growth is $537. Also, a large Double Bottom pattern may form, and in case the price works it off, the aim will move to $645. This scenario, positive for buyers, might be canceled by a breakaway of $365, in which case the asset will further decline to $250.
Photo: RoboForex / TradingView
On smaller timeframes, the price is pushing off the resistance area at $495. However, the resistance line on the RSI was broken away, which means the asset may go on growing to $537. The growth may not happen if the price secures under$413, which will signify a breakaway of the lower border of the ascending channel and a possible decline deeper to $364. A strong signal confirming the growth is the cancellation of the Head and Shoulders reversal pattern that was going to form on the chart; now the price may easily go up for the height of the pattern.
Photo: RoboForex / TradingView
LitecoinOn D1, the quotations are bouncing off $65, which is the key resistance area in the buyers’ way. If sellers seize the initiative, and we witness falling below $53, only further falling to $40 will be possible, because the current price structure looks like a Head and Shoulders pattern is forming. However, the price may still secure above $69, which will mean a breakaway of the upper border of the Triangle. In this case, we may expect growth to $76 and then – to $85. Another signal confirming this movement is a bounce off the support level on the RSI.
Photo: RoboForex / TradingView
On H4, the quotations have secured above the upper border of the descending channel, which means that the asset may go on growing. A strong signal confirming the growth is constant bounces off level 30 on the RSI. The scenario may be canceled by falling below the lower border of the ascending channel and securing under $53.55, in which case the price may proceed further down to $46 and start working off the reversal pattern from D1.
Photo: RoboForex / TradingView
Bitcoin CashOn D1, the quotations keep pushing off the support level, as well as the ascending trendline on the RSI. The price failed to break away the lower border of Bollinger Bands. However, for the growth to be confirmed, we need to see the upper border be broken away and the price secure above $338, in which case the growth may continue to $413. The growth might be canceled by a breakaway of the lower border of the ascending channel and securing under $247, which will entail further falling to $203.
Photo: RoboForex / TradingView
On H4, the quotations have left the Wedge pattern, which means the asset is going upwards, working off the pattern, with a potential goal at $370. An additional signal here will be a breakaway of the trendline on the RSI; the price has already bounced off this line, which means the price will go on growing to the local high.
Photo: RoboForex / TradingView
EOSThe cryptocurrency keeps testing the resistance level. Note that there is also a reversal Head and Shoulders pattern, as in the case with the Litecoin. If the lower border of the ascending channel is broken away, and the price secures under $2.90, we should expect the quotations to fall to $2.20 and lower because the asset will be working off the reversal pattern. For buyers, it is important that the price renews the local high and secures above $3.95. In this case, we might say that the reversal pattern is canceled and the ascending impulse is developing confidently to $4.65 and higher. A bounce off the support line on the RSI speaks for this idea.
Photo: RoboForex / TradingView
On H4, we can also note a reversal pattern forming. The price has just bounced off the area where the right Shoulder might complete, and if the quotations fail to rise higher, we might expect only falling. SO, for buyers, it is vital to see a confident breakaway of the local high and prevent the price from falling below $2.87 – only then we might expect the uptrend to resume.
Photo: RoboForex / TradingView
Crypto Price Analysis September 2: BTC, ETH, LTC, BCH, EOS
origin »Emerald Crypto (EMD) на Currencies.ru
|
|


