2019-11-27 18:37 |
Coinspeaker
Crypto Price Analysis November 27: BTC, ETH, EOS, LTC, BCH
Dmitriy Gurkovskiy, a senior analyst at foreign exchange broker RoboForex, shares his insights into the future scenarios for Bitcoin price movement as well as possible price swings of major altcoins.
Regardless of the new loss of the bulls, the Bitcoin is testing an important support level and there is a reversal pattern forming on the smaller timeframes, which may signify the beginning of an uptrend.
The daily chart of the Ethereum demonstrates uninterrupted falling to the aim at $100 – here, the buyers need maximum effort to change the situation. The Litecoin and Bitcoin Cash also give no hope for growth but we may count on a correction with a subsequent wave of decline. The EOS is preparing for further falling but there is a chance of a bullish model to form to reach $5.75.
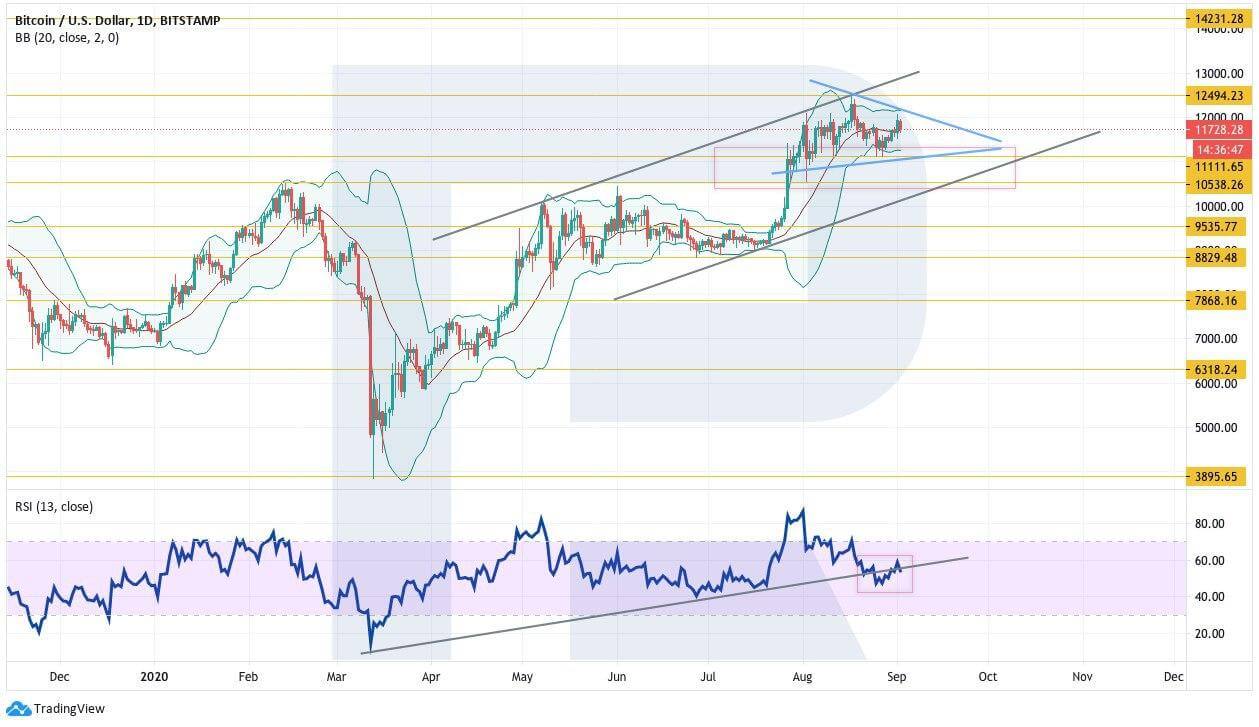
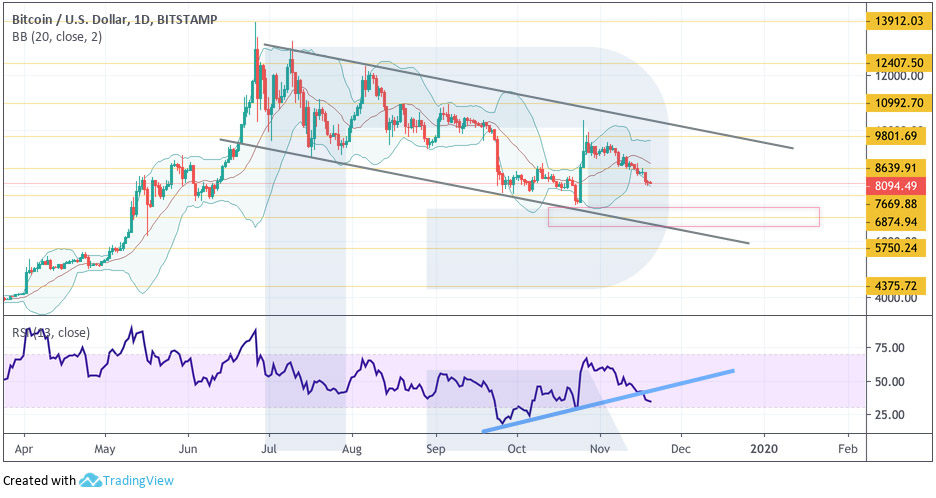
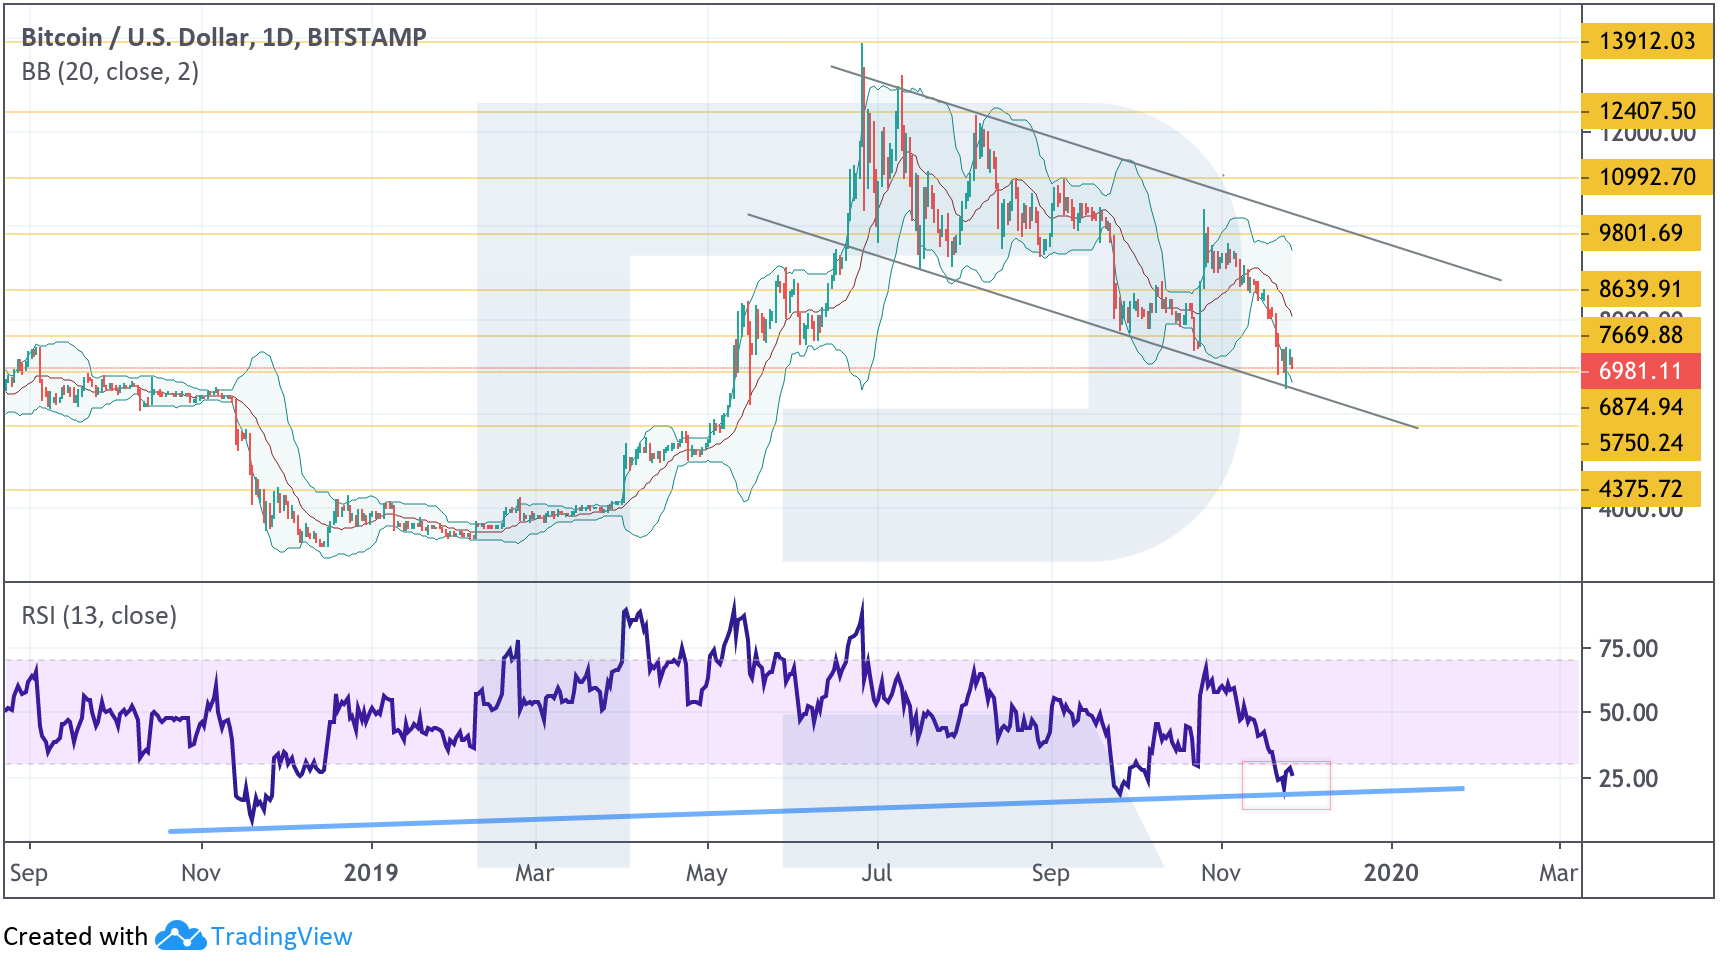
BitcoinThe quotations of the leading cryptocurrency have managed to renew the local minimum again. The price is currently testing the support level. According to the Bollinger Bands indicator, there is a strong downtrend – the sellers manage to hold the price near the lower bands of the indicator. On the RSI, the ascending support line has also been tested. We should expect a test of the lower border of the descending channel and attempts of growth to the aim of around $9800. The positive scenario may no longer be valid in the case of strong falling and a breakout of the lower border of the descending channel, securing below $5750, which will point at a potential test of $4375.
Photo: Roboforex / TradingView
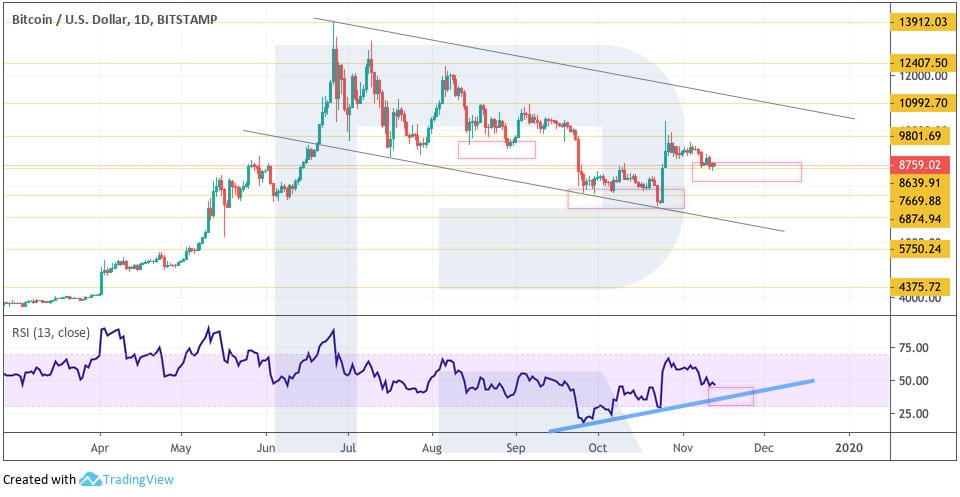
On H4, the quotations are testing the lower border of the descending channel, showing perspectives of a bounce and a movement to the upper border of the channel. The scenario is confirmed by a reversal Head and Shoulders pattern forming. The growth should be confirmed by a breakout of the resistance level and the price securing above $7670, which will signify the completion of the Head and Shoulders and the escape of the quotations from the channel. The scenario may be canceled if the quotations keep declining below $6200, after which they may fall for the width of the channel.
Photo: Roboforex / TradingView
EthereumThe price has bounced the Moving Averages level again, which signifies a downtrend and bearish activity. The RSI values have broken the support line and have tested the line from below. We should expect further falling with the aim at $120, and a breakout of this level will point at a decline to $100. The scenario, negative for the bulls, might be canceled by strong growth to $185, which will mean an escape from the descending channel. If so, the price may rise to $240.
Photo: Roboforex / TradingView
On the smaller timeframes, the sellers have secured under $150. As a short-term trading idea, we should expect a decline to $120. Another bounce off the descending trendline on the RSI may confirm the falling. With the breakout of the lower border of the descending channel, we may expect further falling for the width of the channel. The scenario may be canceled if the price returns to $173, in which case the growth may aim at $200.
Photo: Roboforex / TradingView
EOSThe quotations remain under the Ichimoku Cloud which confirms a downtrend. However, there are reasons for the asset to start growing soon. Currently, the prices are testing the support area, on the RSI as well, where the support line was ascending. These factors signify a potential bounce. To secure the reversal, the bulls need to push the price above the Cloud, after which we may be speaking about further growth. Also, an ascending pattern, the Wolfe Wave, may form, with the first aim at $5.75. The growth may be canceled by a breakout of $2.07, which will cancel the pattern and mean further falling.
Photo: Roboforex / TradingView
On H4, the quotations are also below the Cloud. The RSI values are far from the support line, which may signify a decline from the current levels to the area of $2.07. After this, we should expect the beginning of growth, which may be confirmed by a breakout of the upper border of the Cloud and securing above $3.15.
Photo: Roboforex / TradingView
LitecoinThe quotations keep declining after a bounce off the upper border of the descending channel. On the RSI, the ascending trendline has met the support area. There is a potential for a correction with the test of the nearest resistance area at $55, from where further falling will follow with the aim at $21.The scenario might no longer be valid in the case of strong growth and securing above $64, which will mean an escape from the descending channel and further growth to $79.
Photo: Roboforex / TradingView
On the smaller timeframes, the price has slumped under the support area. There is a good chance for further falling, which is supported by a bounce off the resistance line on the RSI. The first aim of the decline may be at $30. The scenario may be canceled by strong growth with a breakout of the upper border of the descending channel and securing above $55. In this case, we should expect further growth to $64 and then – $79.
Photo: Roboforex / TradingView
Bitcoin CashUnfortunately, the buyers have failed to stop the bears and execute the reversal Head and Shoulders pattern. If the pattern is canceled, which is happening now, there is a risk of strong falling to $100. However, before the decline, a test of the resistance level at $265 should not be excluded. The scenario may nop longer be valid in the case of strong growth above the upper border of the descending channel and securing above 340, which will signify further growth to $455.
Photo: Roboforex / TradingView
On the smaller timeframes, the prices remain inside the descending channel. On the RSI, the resistance line is slightly higher, which means an insignificant potential of growth with a test of $250. After that, we should expect further falling with the first aim at $200. A breakout of the lower border of the descending channel will provoke further decline. The negative scenario may be canceled in the case of a breakout of $265, which will mean an escape from the channel and further growth to $340.
Photo: Roboforex / TradingView
Crypto Price Analysis November 27: BTC, ETH, EOS, LTC, BCH
origin »Bitcoin price in Telegram @btc_price_every_hour
Emerald Crypto (EMD) на Currencies.ru
|
|


