2021-11-2 07:50 |
Compound (COMP) has been decreasing inside a corrective pattern since the beginning of July, but could soon break out from it.
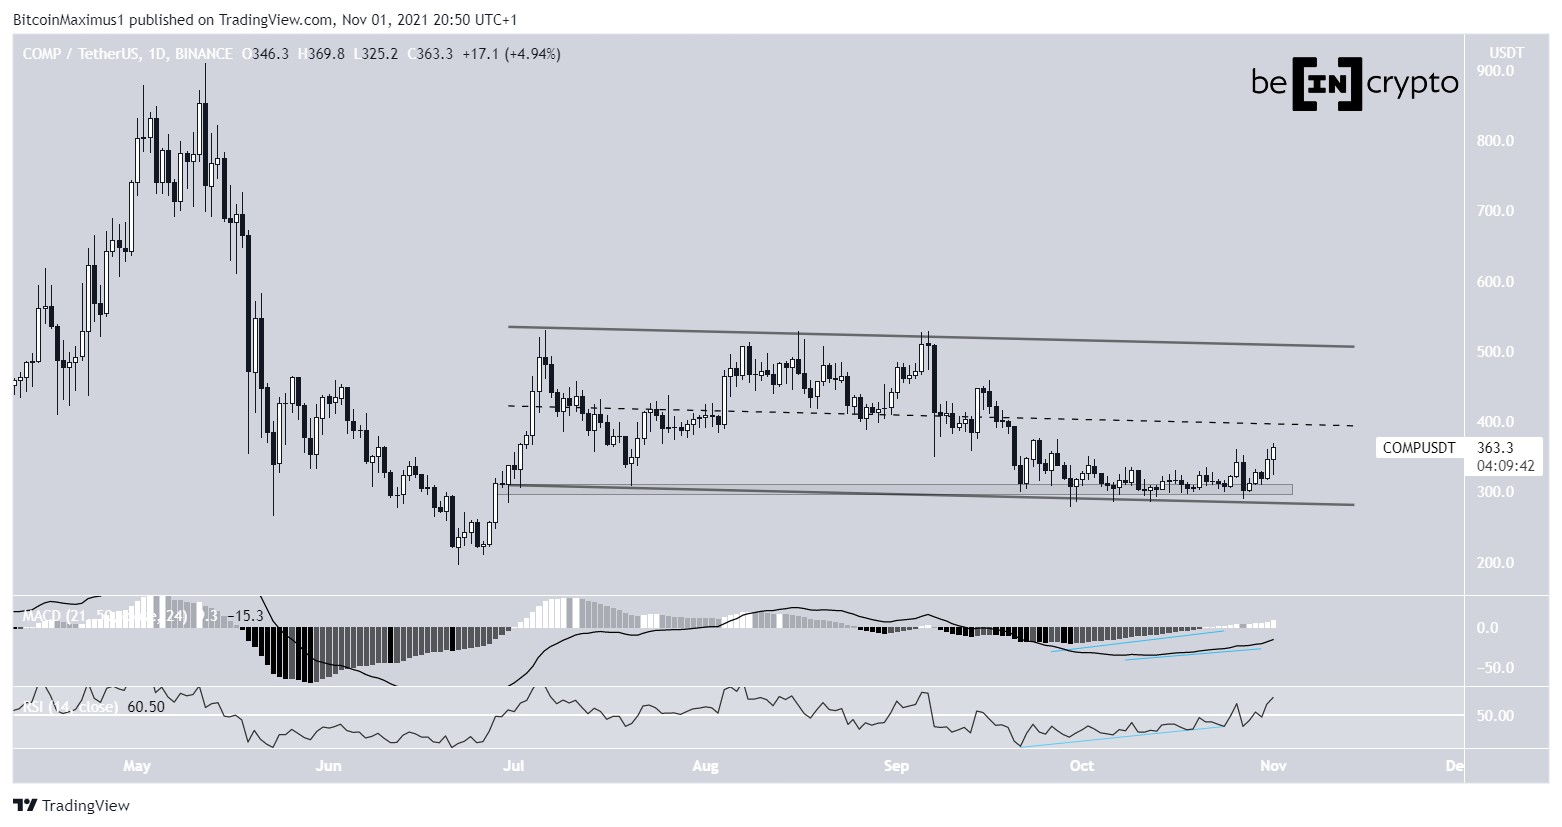
COMP began an upward movement on Oct 27, after trading close to the $3.06 horizontal support area for more than a month.
The upward movement was preceded by bullish divergences in both the RSI and MACD. This means that despite the price decreasing/staying at the same level, momentum has been moving upwards.
The RSI, which is a momentum indicator, has generated a bullish divergence and moved above 50. This is a sign of a bullish trend which often occurs at the beginning of new upward moves.
The MACD, which is created by short and long-term moving averages (MA) is increasing and is nearly positive. This also supports the possibility that the trend is bullish.
Furthermore, COMP has been trading inside a descending parallel channel since the beginning of July. Such channels are normally considered corrective patterns and often lead to breakouts.
Reclaiming the midline of the channel would further solidify the possibility that COMP will break out.
COMP Chart By TradingView COMP wave countCryptocurrency trader @Altstreetbet outlined a COMP chart, stating that it’s in the beginning stages of a new upward move that could take it to a new all-time high price.
Source: TwitterThe most likely wave count suggests that COMP has just begun wave three of a new five wave upward movement.
Wave three is usually the sharpest out of the five, so the rate of increase would be expected to greatly accelerate soon.
The most likely target for the top of wave three is found at $813. This would give waves 1:3 a 1:1.61 ratio and would coincide with the all-time highs of May.
COMP Chart By TradingViewFor BeInCrypto’s latest Bitcoin (BTC) analysis, click here.
The post Compound (COMP) Begins to Increase After a Month of Consolidation appeared first on BeInCrypto.
origin »Bitcoin price in Telegram @btc_price_every_hour
Compound Coin (COMP) на Currencies.ru
|
|


