2021-6-12 10:34 |
In today’s on-chain analysis, BeInCrypto looks at the behavior of long- and short-term bitcoin (BTC) holders in the context of the ongoing cycle trend.
Does the behavior of long-term holders indicate that the bull market is over, and we are in for a long bear market? Or is the current sell-off typical of mid-cycle and will fuel a subsequent uptrend continuation.
To answer these questions, we will first define who we can consider a long-term holder. Then, we will see how the positions held by long- and short-term participants have changed recently. Finally, we will look at Net Unrealized Profit/Loss (NUPL) charts for the two types of holders and compare them to similar levels from previous BTC cycles.
Who are the long-term holders?In the articles published in March and November 2020, two analysts, Rafael Schultze-Kraft and Kilian Heeg, introduced the definitions of long-term and short-term market participants.
Long-Term Holders (LTHs) are also sometimes called “investors.” They have a so-called low time preference and are willing to hold their cryptocurrencies for a long time. Their goal is to avoid the danger of periodic price fluctuations in favor of more certain profit in the future. LTHs believe that, at the end of the day, the price of bitcoin only goes up, so they don’t close their positions at temporary lows.
Short-Term Holders (STHs) are known as “traders,” even though they often do not trade professionally. They have a so-called high time preference and are driven by the desire to multiply their money quickly. Their aim is to take advantage of uptrends, periodic hype, and euphoria in the market, to make instant profits. STHs do not hold onto losing positions, but usually close them when the loss exceeds the tolerable threshold.
To quantify the difference between the two types of holders, the authors introduced a sharp threshold of 155 days for a given UTXO age. After 155 days, the holder of a given address can be considered a long-term investor. Before that time, it is a short-term trader. Rafael Schultze-Kraft stated:
“Therefore, we define 155 days as the minimum age at which we consider that a UTXO is controlled by a Long Term Holder (LTH). Conversely, Short Term Holders (STH) are defined by all UTXOs with a lifespan of less than 155 days.”
More recently, this sharp threshold was somewhat softened in favor of a weighted curve that makes the transition from a short-term to a long-term holder smoother and less arbitrary. The longer coins are held within a given UTXO, the more of an investor it is. Naturally, the shorter it is, the more of a trader it is.
From LTH to STH and back againHistorically, the periods of accumulation and growth in long-term investor positions have been the times of relatively weak bitcoin price actions. Conversely, during the periods when investors increasingly continued to sell off their coins, the price of BTC tended to increase.
The opposite is true for short-term traders, however. When the price of bitcoin increases, they buy and add to their positions. On the other hand, when it drops, they sell.
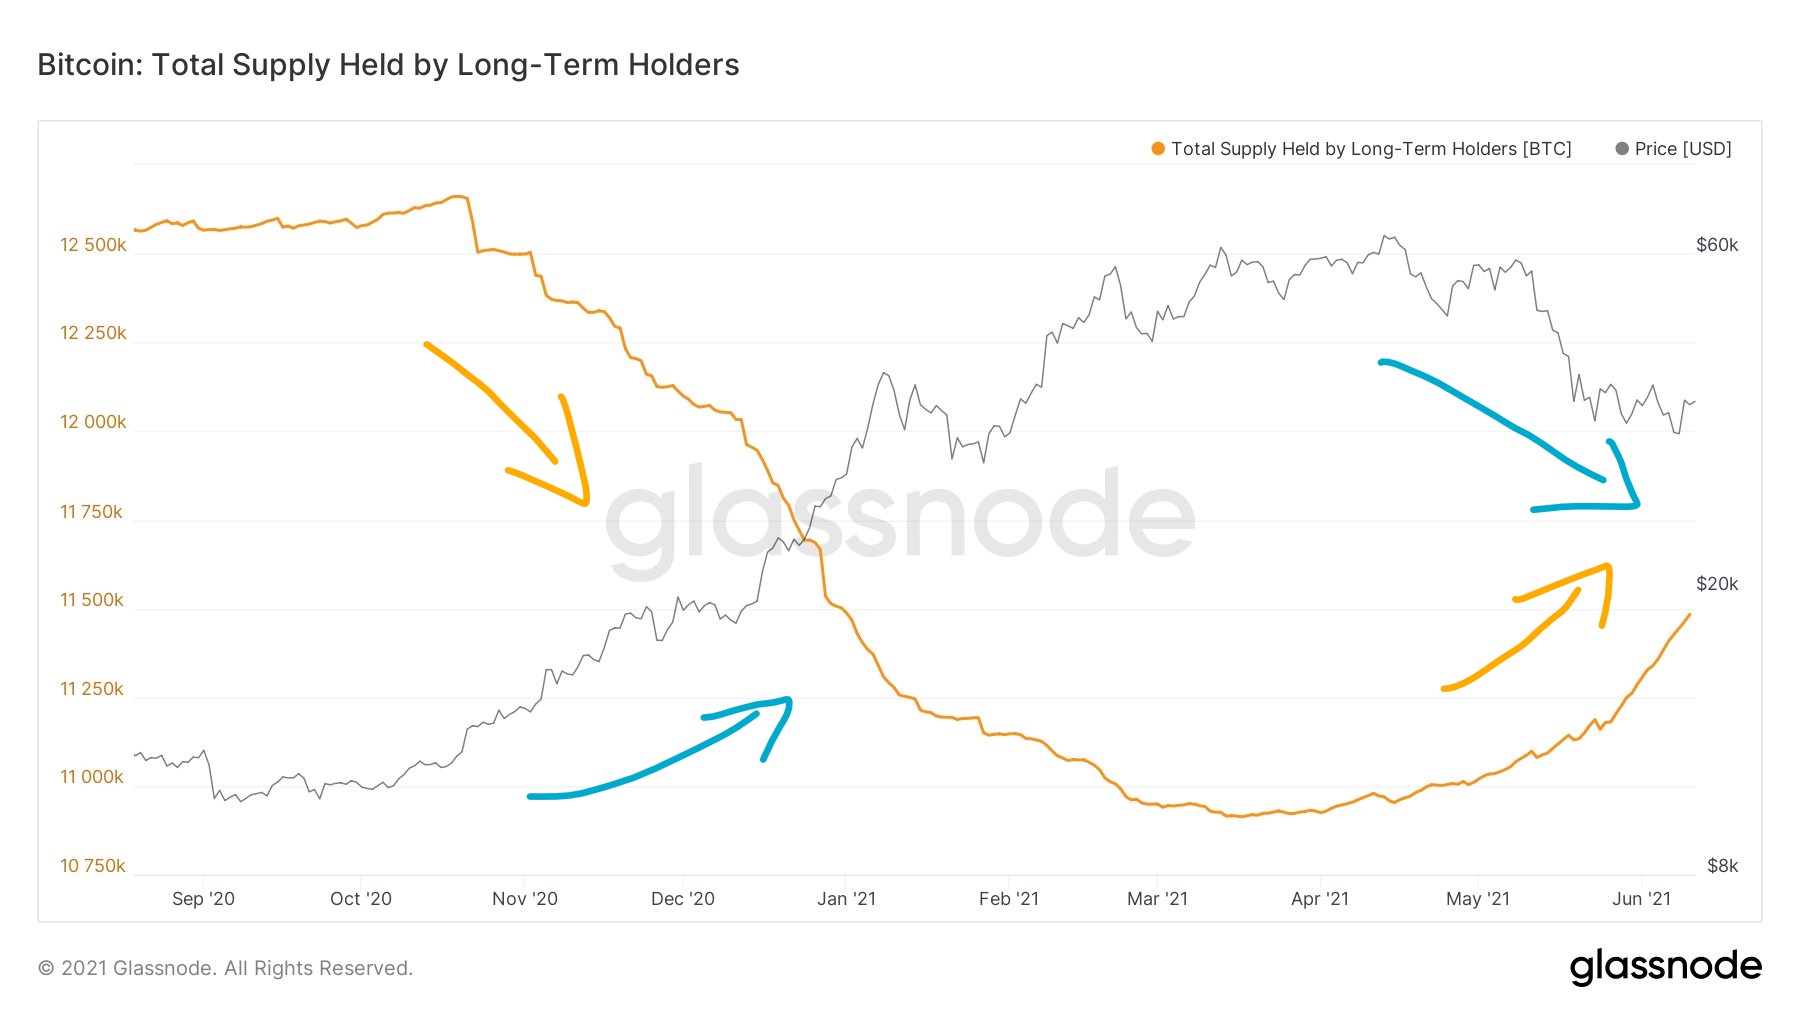
Both trends were clearly visible this year. The positions of long-term holders were steadily decreasing from October 2020 until the April peaks of the Wyckoff distribution, which ended with a monumental crash, in May 2021.
Total Supply Held by Long-Term Holders. Source: GlassnodeHowever, even during these drops in the BTC price, we already see an increase in buys by LTHs. These buyers are only gaining strength in the current consolidation/accumulation period. The arrows shown in the chart indicate that the volatility of the LTH position is inversely proportional to the BTC price.
In contrast, during the same bull market period from October 2020 to April 2021, the positions of short-term holders clearly increased. Some of them even managed to sell near the peak, but since then, there has been a clear downward trend among STH positions.
Total Supply Held by Short-Term Holders. Source: GlassnodeHere, the arrows show that the volatility of STH positions is directly proportional to the BTC price and virtually follows it.
The exact numbers were provided on Twitter by @WClementeIII. According to the information they presented:
Long-term holders bought 397,487 BTC, last month.Short-term holders sold 428,749 BTC, last month.The analyst added that after such a significant exchange — from weak to strong hands — we may witness a short-term downward move. However, in their opinion, “the accumulation process is almost complete.”
Total Supply Held by Short-Term Holders vs Long-Term Holders. Source: Twitter Is this the beginning of a bear market?In a recent analysis, Glassnode published a chart of the change in the position of long-term holders, looking for parallels with the 2016/2017 BTC cycle. The change in behavior of LTHs, who have returned to accumulation, could be a signal of an upcoming bear market.
Long-Term Holder Net Position Change. Source: GlassnodeAnother chart from Glassnode that compares the LTH and STH supply in profit/loss provides a similar argument. At the current valuation of BTC, most of the long-term holders, who were buying in 2020, remain in profit (dark purple).
Long- and Short-Term Holder Supply in Profit/Loss. Source: GlassnodeIn contrast, most short-term traders are in losses (light red). Some of them are also joining LTHs, as the five-month threshold of keeping coins has been increasingly crossed, as the days go by.
NUPL of 2013 gives hope to bullsThe last indicator that sheds light on the behavior of the two types of holders is NUPL. Let’s look at its long-term charts separately for STHs and LTHs.
The current NUPL for STHs is approaching -0.5 (blue line). Reaching this area and lower values (yellow circles) has typically occurred in a deepening bear market, especially not long after the peak of the cycles had been reached, in both 2013 and 2017.
Short Term Holder NUPL. Source: GlassnodeHowever, the hope for bulls to continue the long-term bull market comes from the 2012/2013 mid-cycle chart, where BTC experienced a double top. At that time, the NUPL for STHs fell dramatically (green circle) only to quickly recover to a state of hope, optimism, and faith, a few weeks later.
Interestingly, the NUPL chart for LTHs provides a similar perspective. Here, too, we see that a drop below the current value near 0.75 (red line) was a strong signal for a continuation of the bear market (red circles).
Long Term Holder NUPL / Source: GlassnodeThe only exception was the double peak cycle (green circle). At that point, long-term holders briefly dipped into the green area of belief, only to quickly return to a state of euphoria and continuation of the bull market.
In recent weeks, we have seen increased accumulation of BTC by long-term holders. In previous cycles, this behavior was indicative of a bear market, but it also helped better investigate potential market bottoms.
However, according to the NUPL indicator for LTHs and STHs, there is the potential for a continuation of the long-term bull market. This will apparently happen if bitcoin’s current cycle is similar to the 2012/2013 double peak run.
For BeInCrypto’s latest Bitcoin (BTC) analysis, click here.
The post BTC On-Chain Analysis: LTHs Accumulating – Is This a Bear Market Signal? appeared first on BeInCrypto.
origin »Bitcoin price in Telegram @btc_price_every_hour
Bitcoin (BTC) на Currencies.ru
|
|
