2022-1-1 19:35 |
Today’s on-chain analysis summarizes 2021 in the Bitcoin (BTC) market, during which high volatility in the BTC price was combined with macro consolidation and generally sideways price action. BeInCrypto compares the values of several key on-chain indicators from the beginning and end of the year.
The Bitcoin price is up 65.50% year-to-date and is closing in around $48,000. The percentage of supply in profit is 72.79% today. NUPL is at a key support level at 0.49. The amount of BTC in the hands of LTH has increased by 16%. The Bitcoin network’s hash rate today is 168 EH/s and is slightly below its ATH.
Annual growth of BTCBitcoin (BTC) opened the year with the price of $29,000 and closes around $48,000. This gives an annual increase of 65.50% or $19,000.
Meanwhile, the largest cryptocurrency has reached two major peaks (orange). The first was reached at the level of $64,895 on April 14. The second reached the level of $69,000 on November 10 and represents the current all-time high (ATH). Today’s price is therefore 30% below the ATH.
BTC chart by TradingviewIn general, Bitcoin has been in a large consolidation in the $29,000 – $69,000 range throughout 2021. This resembles a parallel channel with a median at $49,000. At the same time, the market experienced high volatility as trading moved from channel resistance, through the median, to support and vice versa.
Interestingly, the macro bottom reached in the summer, during the May-July period, also reached the $29,000 level with which BTC started the year. In contrast, the year-end close is very near the median of the channel, around $48,000. This indicates a constructive year-long consolidation in which high volatility went hand in hand with sideways price action.
Percent Supply in ProfitPercent Supply in Profit is an indicator that measures the number of coins whose price during the last move was lower than the current price. At the beginning of the year, as many as 99.29% of Bitcoins in circulation were in profit (blue line) and the BTC price was $29,000. Values in the 87-100% range persisted through the first months of the year until reaching April’s ATH.
Bitcoin Percent Supply in Profit by GlassnodeHowever, the subsequent drop in the BTC price was followed by a sharp reduction in the supply in profit. At the time of reaching the summer low, only 65.82% of Bitcoin was in profit (gray area). Further up, the chart again moved upwards to approach 100% near the November ATH.
Today, 72.79% of the supply is in profit and this is relatively low for the year (red line). Despite the BTC price oscillating around $48,000, the supply in profit indicator is reaching levels from around May-July. Perhaps this is a bullish signal pointing to another period of accumulation.
NUPLNet Unrealized Profit/Loss (NUPL) is the difference between relative unrealized profit and relative unrealized loss. It can also be calculated by subtracting the realized market capitalization from the market capitalization and then dividing the result by the market capitalization.
The annual NUPL chart provides an interesting insight into the BTC market and fits into the narrative of long-term consolidation. First of all, the value of the indicator at the beginning of the year was 0.68 (blue line) and at the end it was 0.49 (red line). For most of the year, the indicator was in the green belief/denial range between 0.5 and 0.75.
NUPL chart by GlassnodeInterestingly, despite a 65.50% increase in the price of BTC, the value of NUPL is down 0.19. In other words, the market has a larger unrealized loss today despite the price of Bitcoin being higher than it was at the beginning of the year.
Further, it is worth noting that the annual peak of NUPL was 0.75 on February 21 (blue circle). This number is crucial because all previous peaks in the BTC price have coincided with values above 0.75, i.e. in the blue euphoria/greed range. So far in this cycle, this range has not been reached.
At the same time, NUPL’s one-year low was 0.35 on July 20 (red circle). This reading remained in the yellow optimism/anxiety area despite the strong correction in the BTC price. At the end of the year, the NUPL is pointing to the borderline value of 0.49, where it was last located in September. A potential return to the green area above 0.50 will be an indicator of the continuation of the bull market and the maintenance of the bullish long-term consolidation.
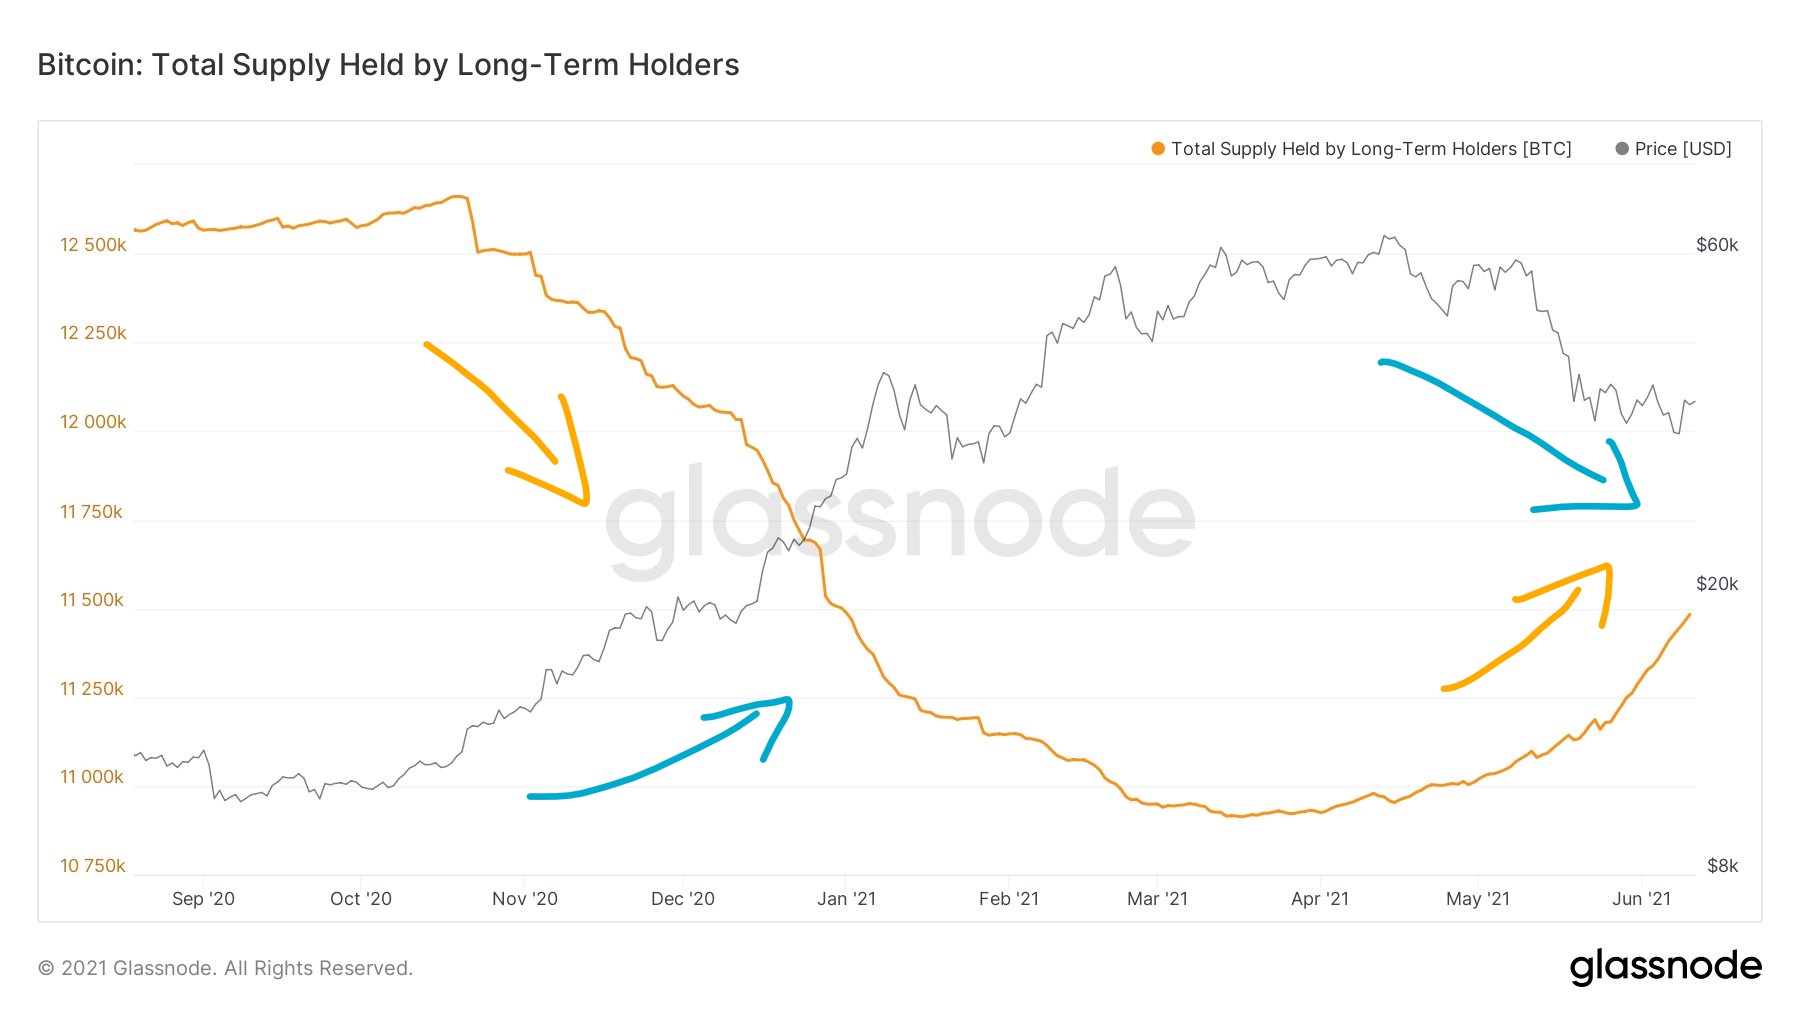
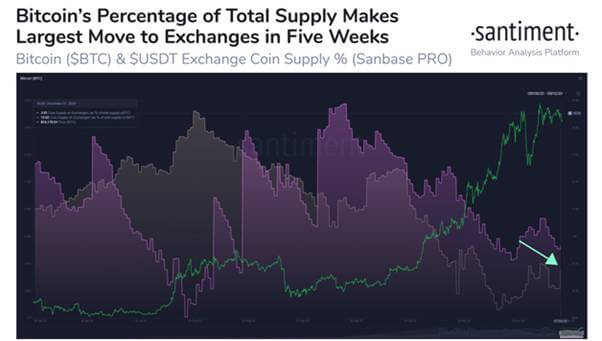
BTC supply distributionA recent report from Glassnode features a chart that compares the supply of Bitcoin in the hands of long-term and short-term holders (LTH and STH), the amount of BTC on exchanges and the so-called sovereign supply. The latter is defined as all coins outside the reserves of exchanges.
According to the chart, the past year brought a change in the ratio between LTH and STH in favor of the former. LTHs currently hold 13.33 million BTC, and the supply of those holding coins for more than 155 days increased by 16% year-to-date. STH, on the other hand, hold 3.01 million BTC at the end of the year and their supply has decreased by 32%.
Source: insights.glassnode.comThe amount of so-called sovereign supply is today at a new all-time high of 16.34 million BTC. In contrast, exchanges hold 2.56 million BTC as of the end of the year.
Overall, the change in supply between LTH and STH suggests a small transfer of BTC towards long-term holders. This behaviour has historically been observed during bear markets, where coins move from weak hands to strong ones. The data also fits with our hypothesis of a prolonged one-year accumulation and consolidation of the Bitcoin price in 2021.
Hash rateThe final on-chain indicator worth looking at in the 2021 summary is hash rate. This is a fundamental indicator of the health of the Bitcoin network, which measures the average number of hashes per second produced by miners.
Like Bitcoin’s price, the hash rate closes the year at a higher 168 EH/s level than it opened it at 143 EH/s level on January 1. However, the health of Bitcoin’s network experienced its largest ever drop in hash rate, which occurred between May 13 and July 2, when the hash rate bottomed out at 84 EH/s (red circle).
Hash Rate chart by GlassnodeDespite the dramatic events surrounding the mine closure in China, the network quickly recovered its mining capacity. As recently as December, the hash rate reached a new all-time high at 182 EH/s (green circle) and closes the year at 168 EH/s.
This is another on-chain indicator that 2021 was the end of a massive growth, correction and subsequent macro consolidation. Despite this, the Bitcoin network is in excellent shape, global decentralization and mine distribution is increasing, and miners are still interested in mining BTC.
For BeInCrypto’s latest Bitcoin (BTC) analysis, click here.
The post Bitcoin On-Chain Analysis: 2021 Sees Year of Massive Consolidation for Bitcoin (BTC) appeared first on BeInCrypto.
origin »Bitcoin price in Telegram @btc_price_every_hour
Bitcoin (BTC) на Currencies.ru
|
|