2021-8-4 22:45 |
Bitcoin (BTC) has fallen below the $40,550 resistance area.
Ethereum (ETH) is at risk of breaking down from an ascending support line.
XRP (XRP) and Kava.io (KAVA) have reached the resistance lines of their ascending parallel channels.
Voyager Token (VGX) has broken out from a descending resistance line.
Stacks (STX) is attempting to break out above the $1.40 resistance area.
Terra (LUNA) has broken out from a descending resistance line and reclaimed the $11.80 resistance area.
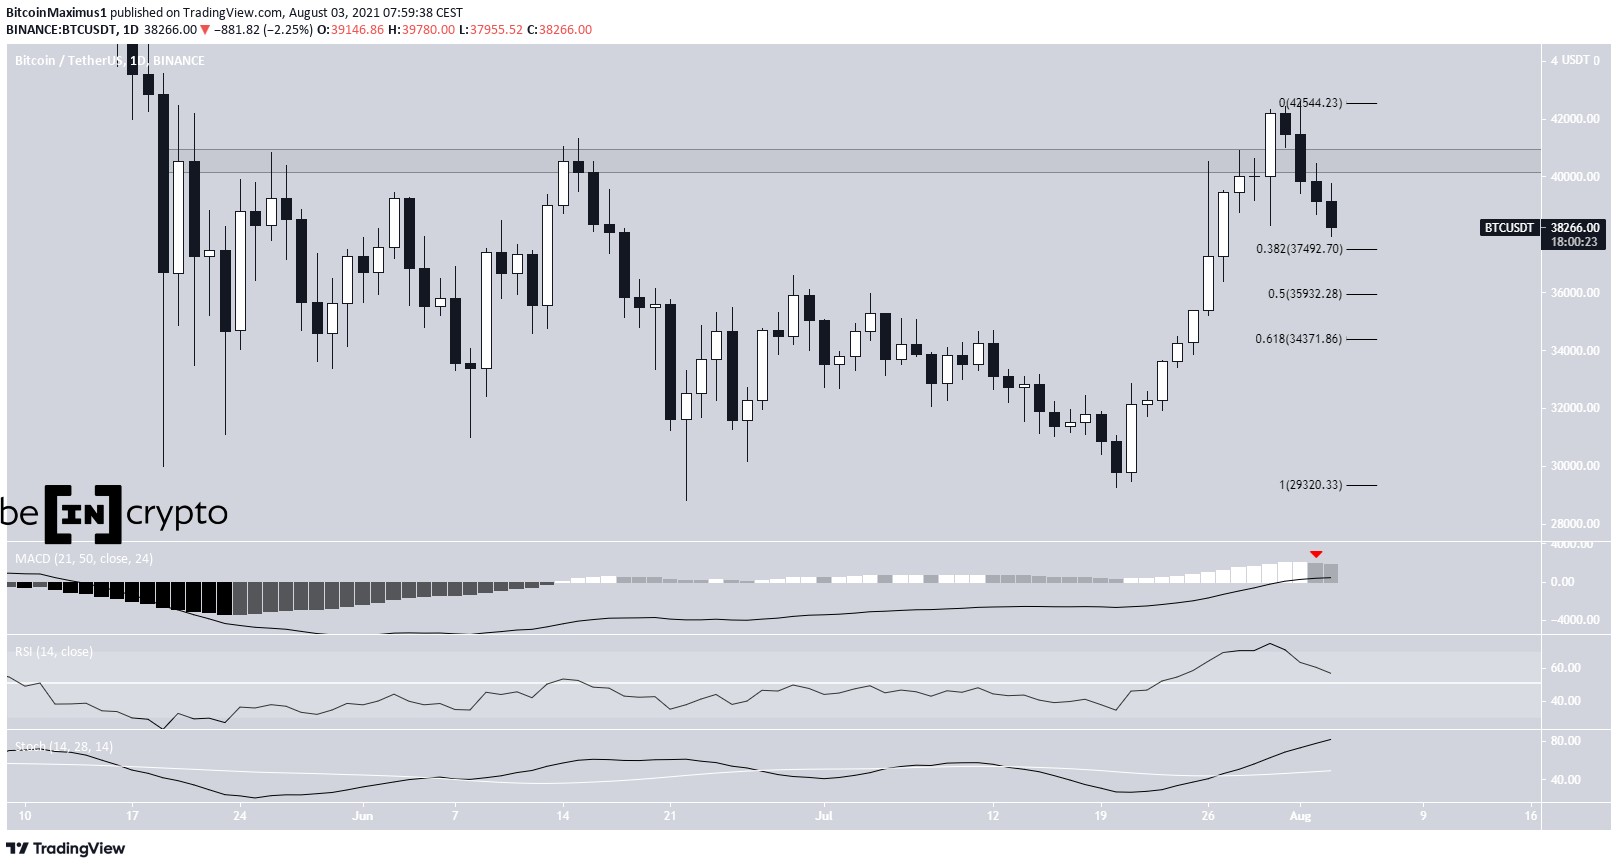
BTCBTC has been moving downwards since it reached a high of $42,599 on Aug. 1. The downward movement took it below the $40,550 area, which is now expected to act as resistance once more. Therefore, what previously seemed like a breakout is now only a deviation.
The main support levels are at $37,500, $35,930 and $34,370. These are the 0.382, 0.5 and 0.618 Fib retracement support levels.
Technical indicators in the daily time-frame are showing signs of weakness. The MACD has created one lower momentum bar and the RSI has fallen below 70. However, the stochastic oscillator is still bullish.
The wave count indicates that the trend is bearish.
Chart By TradingView ETHETH has been moving upwards since July 20, when it was trading at a low of $1,706. The upward movement has been swift, leading to a high of $2,697 on Aug. 1.
The high was made at a confluence of Fib resistance levels, created by the 0.382 Fib retracement resistance level (black) and the 1:1.61 ratio of wave A (orange).
Therefore, it is a likely level for a top to be reached. A breakdown from the current ascending support line would confirm this.
If so, ETH would soon begin a downward movement.
Chart By TradingView XRPXRP has been increasing since June 22. On July 20, it created a slightly higher high and accelerated its rate of increase.
However, the ensuing upward movement ended once the token reached a high of $0.77 (red icon). The high was made inside the $0.77 resistance area. In addition, it coincides with the resistance line of an ascending parallel channel, in place since the aforementioned June 22 low.
Such channels often contain corrective movements.
Unless XRP manages to break out from the channel and reclaim the $0.77 resistance area, the trend remains bearish.
Chart By TradingView KAVAKAVA has been increasing inside an ascending parallel channel since May 19, when it reached a low of $2.10. Afterwards, it bounced twice at the support line of the channel (green icons) before accelerating its upward movement.
On Aug. 3, it managed to reach a high of $6.73. The high was made just above the $6.50 resistance area and at the resistance line of the channel.
However, the token failed to break out and has created a long upper wick instead (red icon).
Until the token breaks out from this level, the trend cannot be considered bullish. The closest support area is at $5.
Chart By TradingView VGXVGX has been decreasing alongside a descending resistance line since Feb. 24. It was rejected by the line five times, most recently on June 30.
However, the token began an upward movement on July 20 and broke out from the line two days later.
The token is approaching the $3.84 resistance, which is both a horizontal resistance area and the 0.382 Fib retracement resistance level.
The closest support area is at $2.50.
Chart By TradingView STXSTX has been increasing alongside an ascending support line since June 22, when it reached a low of $0.50. On July 11, it reached a high of $1.47 but was rejected by the $1.40 horizontal resistance area.
Afterwards, it returned to the ascending support line once more on July 20 (green icon) and is currently making another breakout attempt.
While technical indicators are bullish, they are showing signs of weakness in the form of decreasing momentum in the MACD and potential bearish divergence in the RSI.
The next resistance area is at $1.95, the 0.618 Fib retracement resistance level.
Chart By TradingView LUNALUNA had been decreasing alongside a descending resistance line since March 21. However, it began an upward movement after reaching a low on May 23. It created higher lows on June 22 and July 20 before accelerating the rate of its increase.
On August 1, the token managed to break out from the descending resistance line and reclaimed the $11.80 area in the process.
Technical indicators are bullish, supporting the continuation of the upward movement.
The closest resistance area is at $17.80.
Chart By TradingViewFor BeInCrypto’s latest bitcoin (BTC) analysis, click here.
The post BTC, ETH, XRP, KAVA, VGX, STX, LUNA- Technical Analysis August 3 appeared first on BeInCrypto.
origin »Bitcoin price in Telegram @btc_price_every_hour
Bitcoin (BTC) на Currencies.ru
|
|

