2021-4-14 19:00 |
Bitcoin (BTC) and Ethereum (ETH) have broken out and reached new all-time high prices on April 13.
While some altcoins are currently lagging, the rate of increase is expected to catch up when the BTC price settles.
Bitcoin (BTC)BTC has broken out from a descending resistance line that had been in place since the previous ATH.
It has been moving upwards since it validated the resistance line as support.
Technical indicators have turned bullish, suggesting a new all-time high will transpire.
A breakout above the all-time high could take BTC to at least $83,000 and potentially $90,000.
Chart By TradingView Ethereum (ETH)On April 2, ETH broke out above the previous all-time high resistance area of $2000. After validating it as support five days later, it bounced and began another upward movement.
Additionally, the technical indicators in the daily time frame are bullish, supporting the continuation of the upward movement.
A potential target for the top of this move is found near $3000.
Chart By TradingView XRP (XRP)XRP has been increasing rapidly since initially breaking out on.
However, it has potentially reached the top of wave three (orange). Today’s high was made right at 1:1 Fib projection of sub-wave 1-3.
In addition, there is some bearish divergence in both the RSI & MACD.
After this correction is complete, a move towards $2.25 or potentially a new all-time high is expected.
Chart By TradingView Dogecoin (DOGE)After two unsuccessful attempts, DOGE finally managed to break out above the $0.064 resistance area on April 11.
Additionally, technical indicators are bullish and support the continuation of the upward move. The next resistance area is found at the all-time highs near $0.874.
Chart By TradingView Binance Coin (BNB)BNB has been increasing since breaking out from a symmetrical triangle on March 30.
The increase has been parabolic. The breakout from the triangle suggests that the pattern was wave four, and BNB is now in the fifth and final wave of a bullish impulse.
Besides, it has reached the 2.61 external retracement, a potential reversal area, which has been rejected.
The rate of increase is unsustainable, and an eventual correction is expected.
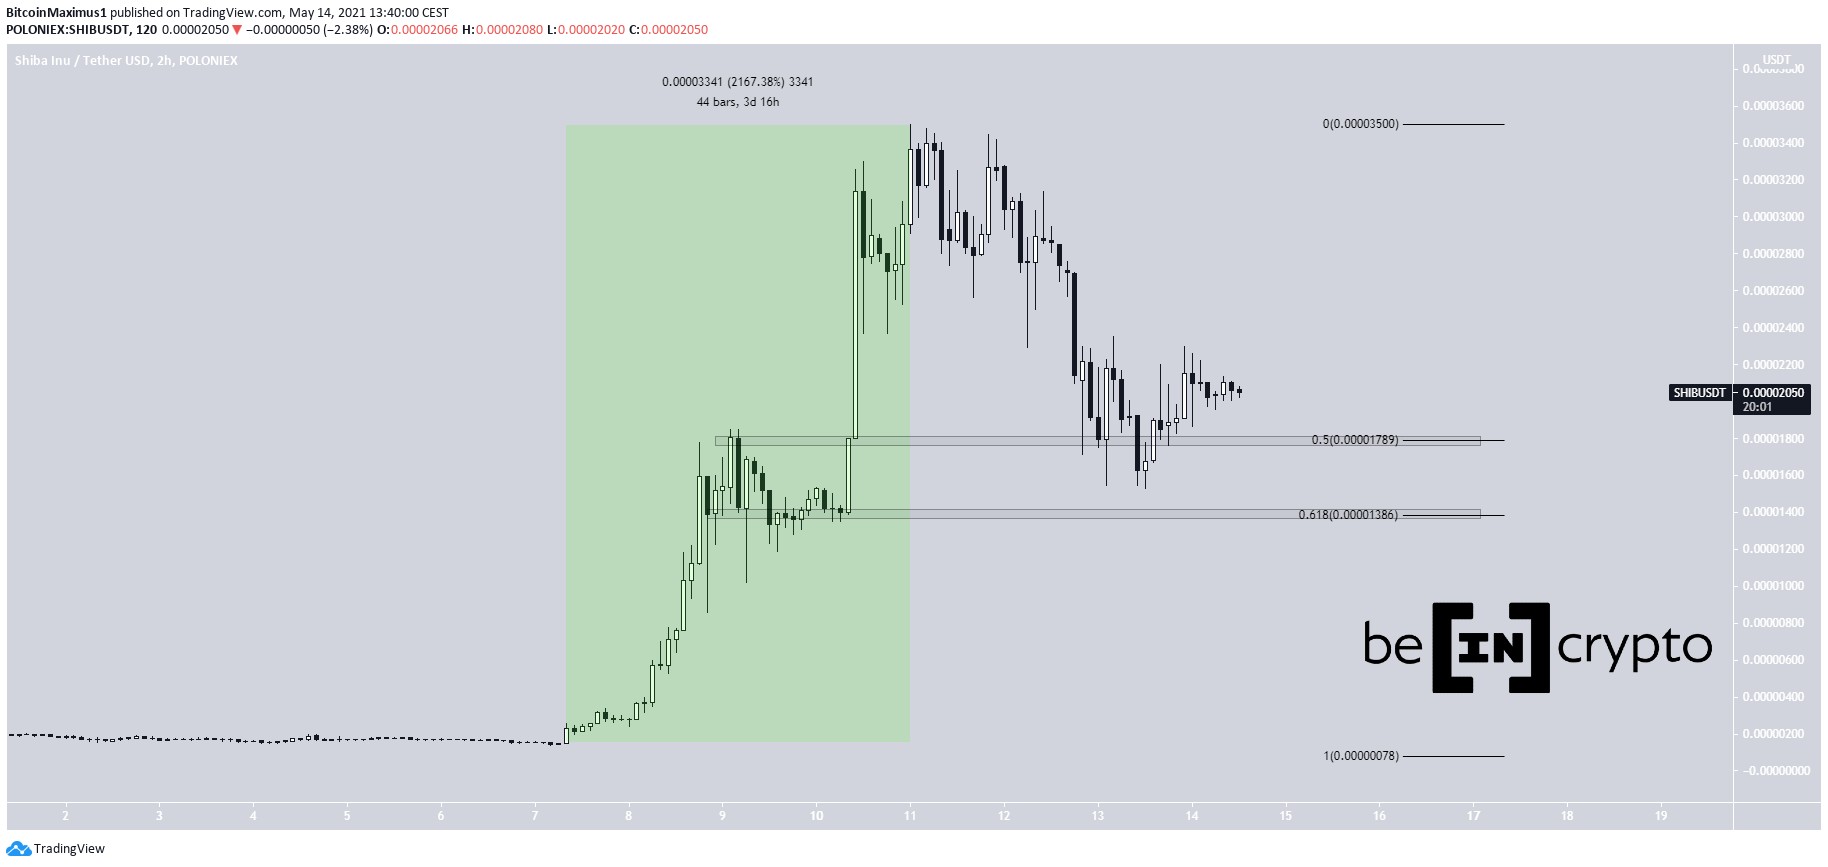
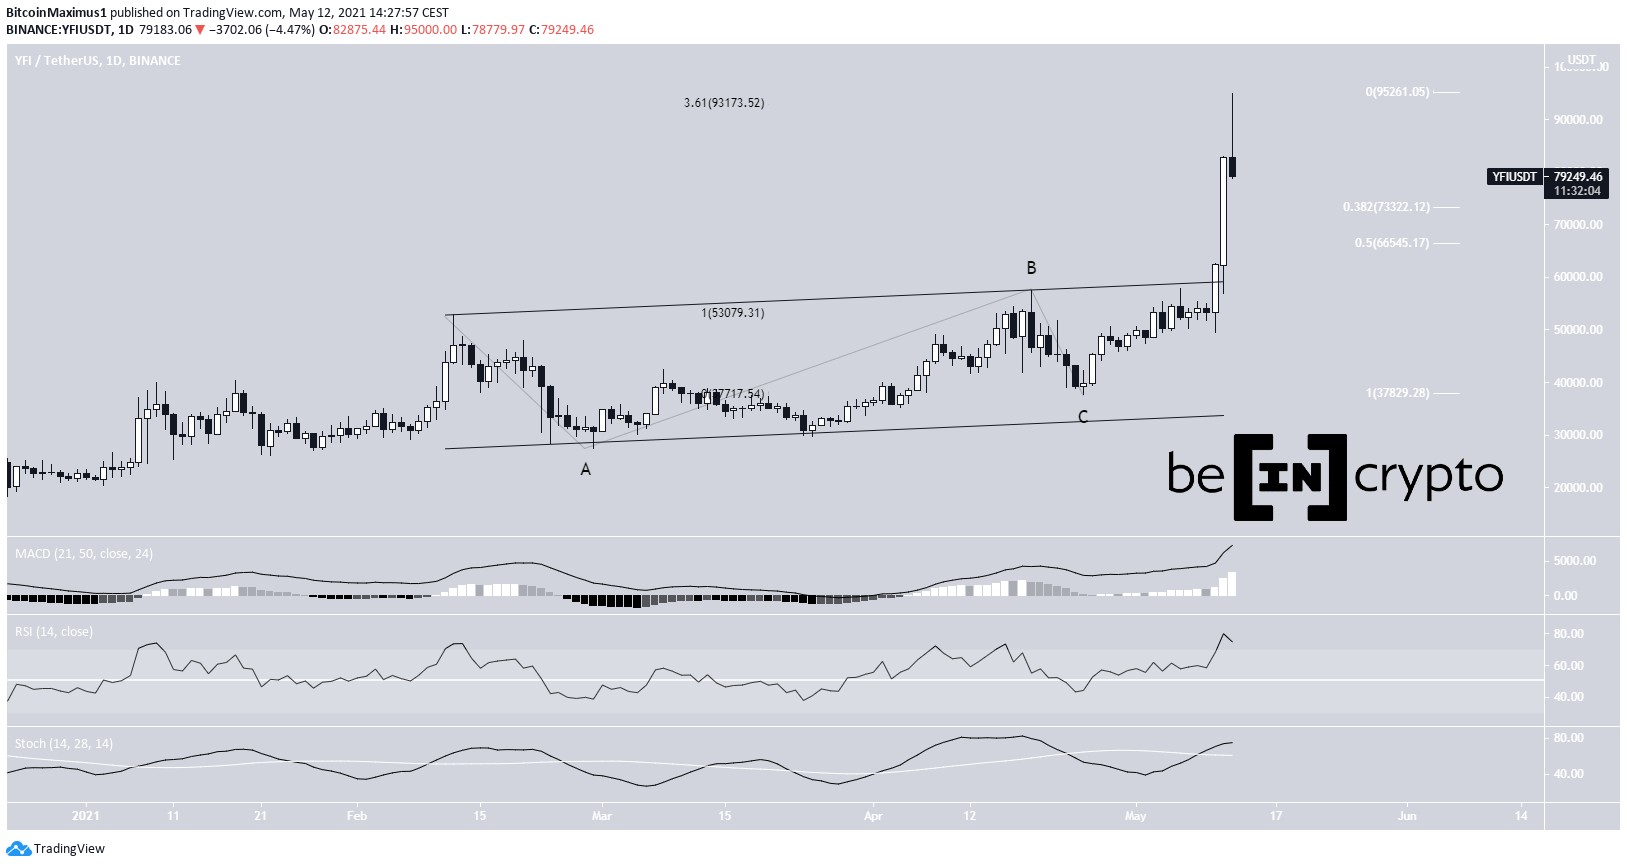
Chart By TradingView Yearn.Finance (YFI)On March 29, YFI broke out from a descending resistance line. It moved above the $4000 horizontal resistance area shortly afterward.
Currently, it is in the process of re-testing the latter as support.
The next closest resistance area for YFI is at $52,900. The token reached an all-time high on Feb. 12. Afterward, the next resistance is found at $68,450.
YFI Chart By TradingView Reef (REEF)REEF has been trading inside a symmetrical triangle since Feb. 11. The triangle is considered a neutral pattern.
In addition, technical indicators are neutral.
A breakout from the pattern would take REEF towards the highs at $0.55.
However, at the current time, whether REEF breaks out or down cannot be accurately determined.
Chart By TradingViewFor BeInCrypto’s latest bitcoin (BTC) analysis, click here.
The post BTC, ETH, XRP, DOGE, BNB, YFI, LRC – Technical Analysis For April 13 appeared first on BeInCrypto.
origin »Bitcoin price in Telegram @btc_price_every_hour
Bitcoin (BTC) на Currencies.ru
|
|