2020-7-15 19:00 |
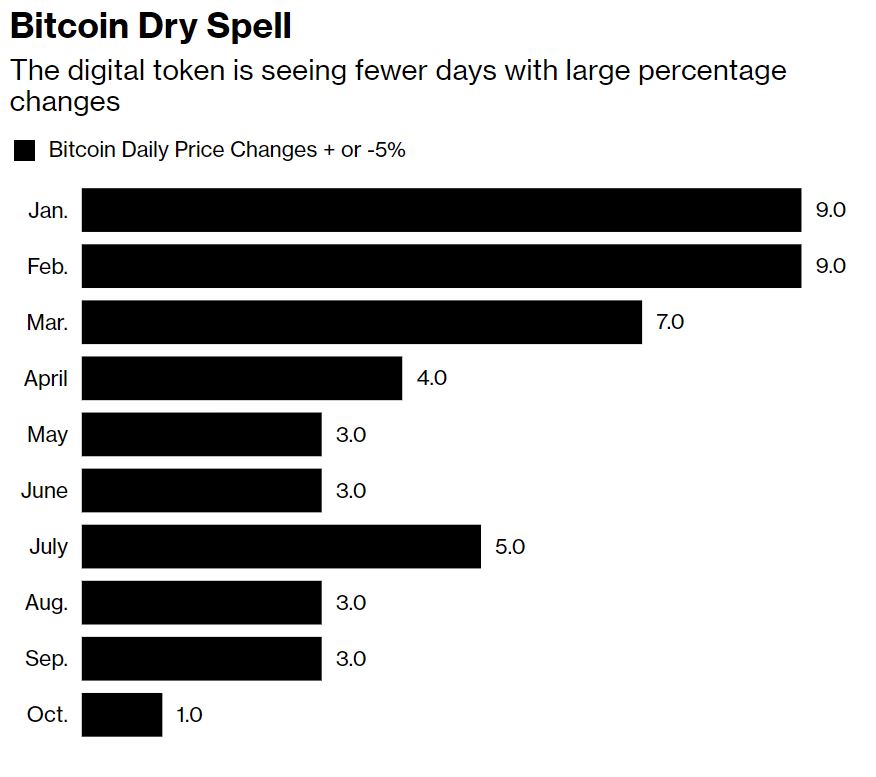
Bitcoin’s extended bout of sideways trading has caused the cryptocurrency to see historically low volatility levels.
In the past, bouts with volatility this low tend to be followed by massive movements that set the tone for which direction the cryptocurrency will trend in the days and weeks ahead.
Analysts are noting that there are a few technical indicators that all are starting to suggest that BTC’s multi-month consolidation phase is drawing to a close.
The next movement it makes will likely break its long-held trading range between $9,000 and $10,000 – setting the tone for where it will trend throughout the rest of 2020.
One byproduct of this consolidation that could further exaggerate the size of BTC’s next movement is its “dying” trading volume, which has hit multi-month lows.
This has caused one research firm to note that this is a “disturbing trend” that could spell trouble for where it goes next.
Bitcoin Flashes Signs of Weakness as Trading Volume PlummetsAt the time of writing, Bitcoin is trading down roughly 1% at its current price of $9,190.
Just a couple of days ago, buyers attempted to break the recent consolidation trend when they pushed its price up to highs of $9,400.
The selling pressure here proved to be insurmountable, and BTC posted a swift rejection that caused it to decline towards its current price levels.
This isn’t the first time Bitcoin has been rejected at this price level either, as $9,400 catalyzed a sharp decline late-last week as well – with the consecutive rejections here pointing to underlying weakness amongst BTC’s buyers.
One trend to consider in the near-term is the massive slide that the benchmark cryptocurrency’s trading volume has seen as of late.
Arcane Research spoke about this within a recent report, explaining that it is a “concerning” trend for the leading digital asset.
“The 7-day average real trading volume continues to trend downwards this week… While the overall trading volume in the crypto market is looking more stable… it is certainly concerning to see this steady downwards trend for the market leader,” they explained.
Image Courtesy of Arcane Research. These Factors Suggest BTC is Gearing Up to Make a Big MovementIt does appear that a few technical factors are signaling that this sideways trading won’t last for too much longer.
One analyst pointed to intense compression seen while looking towards all of Bitcoin’s moving averages as one sign of imminent volatility.
He also notes that the price is hovering beneath all of these technical levels.
“BTC: Wow look at the compression on all the EMA’s/MA’s right now on the 4hr. Price is under all currently and range EQ. I’d have to believe that this compression should bring short term volatility in the very near future.”
Image Courtesy of Pentoshi. Chart via TradingView.The low volume seen by the crypto could also help to exaggerate the magnitude of the next movement.
Featured image from Shutterstock. Charts from TradingView. origin »Bitcoin price in Telegram @btc_price_every_hour
Inverse Bitcoin Volatility Token (IBVOL) на Currencies.ru
|
|