2020-4-24 17:03 |
The Bitcoin (BTC) price has been increasing since reaching a bottom of $3850 on March 13. The latest movements hold many similarities to those after the January 2015 bottom, which was the final low prior to a more than two-year-long upward move.
While the Bitcoin price will not necessarily continue moving in the same manner, the fractal has yet to be invalidated. Well-known trader @Davthewave outlined a price chart that shows the current movement alongside that from 2015, which is shown in blue lines in the image below.
Source: TwitterThe similarities between the two are uncanny and, even though the price has diverged at some moments, it has eventually caught up.
In this article, we will analyze both movements closely and determine if the similarity is likely to continue. We have analyzed this fractal more than two weeks ago, so now is a good time to revisit the prediction and see if the movement has continued mirroring that from 2015.
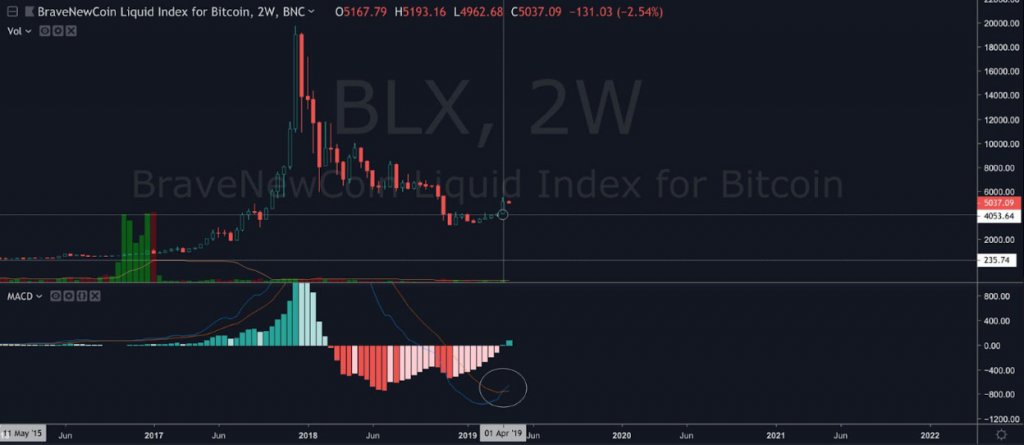
Bitcoin FractalThe previous downward move actually began in November 2013, when the Bitcoin price reached a high of $1,177.63. The downward move continued for 413 days — a time during which the price decreased by 86 percent. The bottom of $163.88 was reached in January 2015.
During this low, the price created a very long lower wick significantly below the 200-week moving average (MA), only to bounce right above it and reach a close. The low was combined with a 27 value in the RSI, indicating oversold levels.
In the current movement, the BTC price decreased by a smaller percentage (70 to 85 percent) and did so in a shorter period of time (259 to 413 days). Also, while the RSI was similar, recording a value of 32, it was slightly higher than that in 2015. All these signs suggest that the 2020 decrease was less rapid than that in 2014-2015.
The relationship of the Bitcoin price to the 200-week MA was identical in both cases. The price decreased below the MA in the form of a long lower wick only to reverse and close right above it.
Bitcoin Chart By Trading View Side-By-Side ComparisonWhen looking at the short-term movement, we can see that the Bitcoin price has begun to diverge. Both movements had a high (green tick), which was followed by a lower high (red cross) and two higher highs. However, in 2015, the price decreased afterward — while it is in the process of creating yet another high in the current movement.
This does not mean that the fractal is invalidated. Rather, it implies that the short-term movement is not exactly identical, as stated in the tweet. If the long-term stays true, the Bitcoin price will soon reach a top and eventually decrease towards $6000 once more.
The 2020 movement is shown in the image above, while the 2015 one in that below.
Bitcoin Chart By Trading ViewTo conclude, the Bitcoin price movement since the March bottom is possibly following a fractal from January 2015. If the fractal continues to hold, the price will soon reach a top and decrease towards $6000.
The post Bitcoin’s Price Movement Can Be Explained by This 2015 Fractal appeared first on BeInCrypto.
origin »Bitcoin price in Telegram @btc_price_every_hour
Bitcoin (BTC) на Currencies.ru
|
|