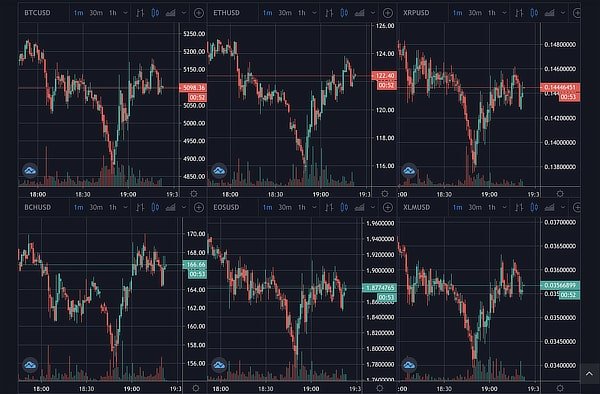
2020-4-15 22:10 |
On April 7, the Bitcoin price reached a high of $7,469. However, it immediately began a downward move and has created two successive lower-highs since then.
This raises the possibility that the price is following a fractal from an almost identical movement that began on February 13.
Well-known trader @CryptoCapo_ tweeted the current BTC movement along with the February fractal which suggests a downward move is likely.
In the tweet, the price has already reached a high and is expected to create two more lower-highs before decreasing, as it did in February.
Top formation still in the making. pic.twitter.com/pGlsGPw0PN
— il Capo Of Crypto (@CryptoCapo_) April 13, 2020
Side-By-Side BTC Fractal ComparisonThe initial movement began after hitting a high of $10,467 on Feb 13. After that, the price created a descending resistance line, which it validated four times before decreasing considerably.
In the current movement, the price has reached a high of $7,469 on April 7 and has been following a descending resistance line, which it has validated thrice. If the fractal continues to hold, the BTC price is likely to validate this line once more before decreasing considerably.
Bitcoin Chart By Trading View February MovesIn February, the entire upward move beginning from the most recent swing-low measured a 16% increase, which occurred over roughly nine days. After, the resistance line stood for nearly 11 days.
The entire decrease, measuring from the first touch of the resistance line, totaled 20% and took a little over 17 days to complete.
Another interesting development is that during the third and fourth touches of the resistance line, the price rallied from below the 200-hour moving average (MA) to touch the resistance above, before decreasing back below the MA.
Bitcoin Chart By Trading View Current TrajectoryIn the current movement, the rally from the recent swing low had a higher magnitude and transpired over a shorter period of time — more specifically 22% over five days.
The price has been following the descending resistance line for seven days and is expected to touch it once more soon. It is interesting that the third touch was above the 200-hour MA and the price decreased below it shortly after, acting in an identical manner to how it did in February.
If the entire downward move follows the previous pattern, the price would be expected to reach a low of $5,600 around April 24. This target fits with the support line of our trading range that has been in place since March.
Bitcoin Chart By Trading ViewTo conclude, the Bitcoin price is possibly following a fractal from February 2020. If the pattern continues, it is likely to touch the current descending resistance line at $7,050 once more before beginning a downward move that could eventually lead to a low of $5,700.
The post Bitcoin’s February Fractal Predicts a Wild Ride Incoming appeared first on BeInCrypto.
origin »Bitcoin price in Telegram @btc_price_every_hour
Bitcoin (BTC) на Currencies.ru
|
|