фото показано с : bitcoints.com
2018-7-29 17:57 |
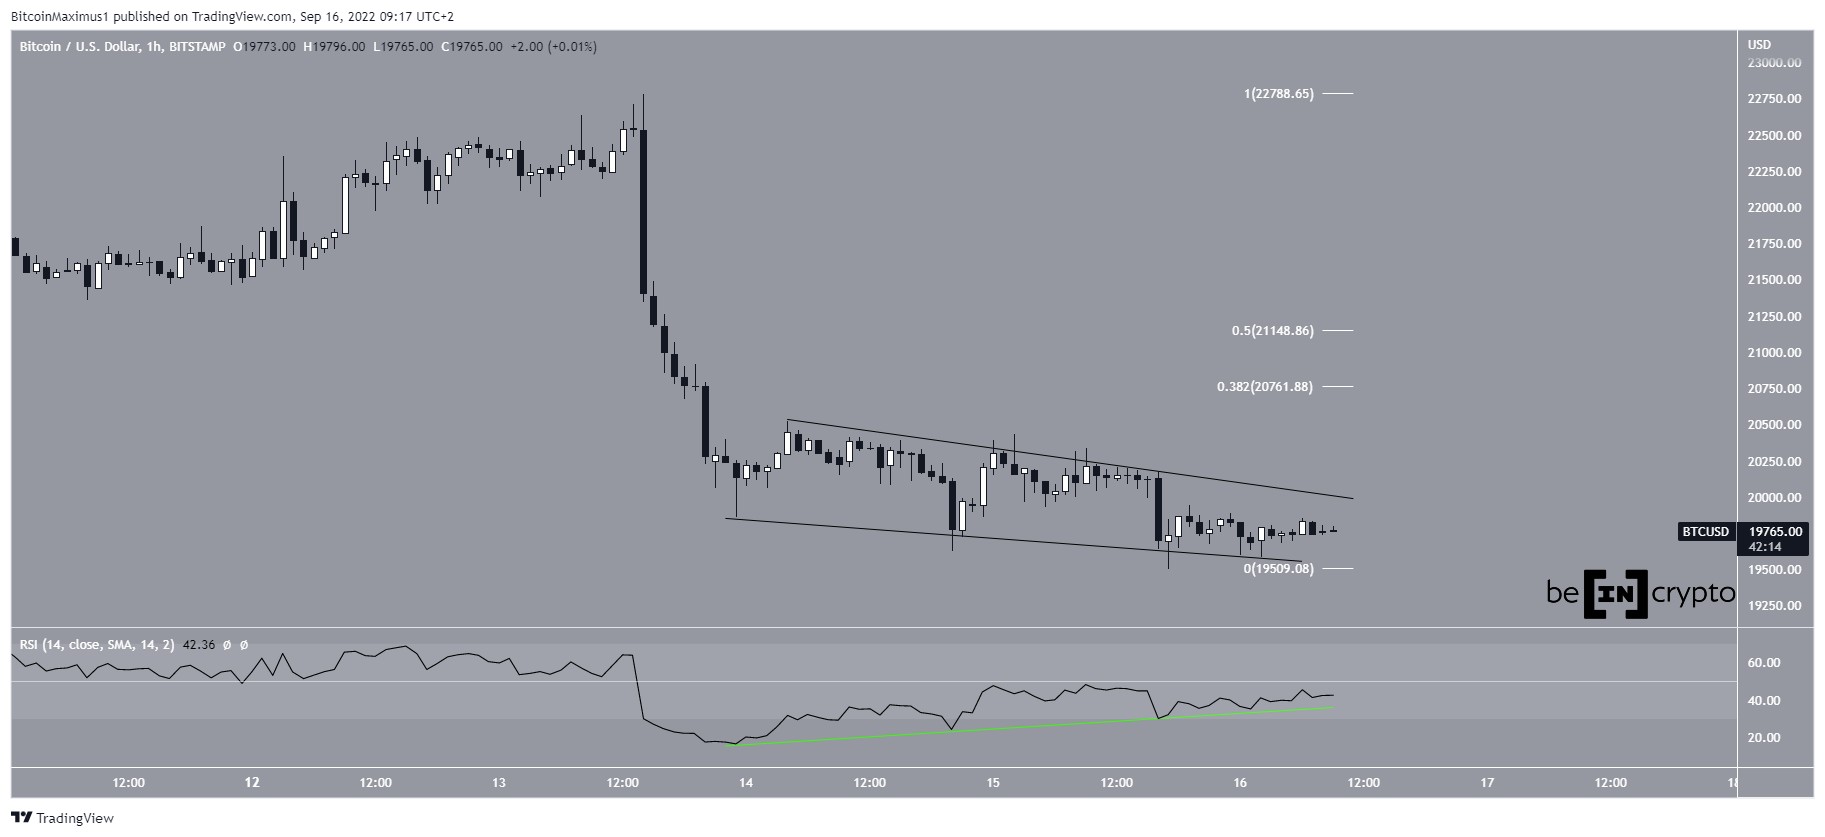
1-Hour Chart Bitcoin 00 remains above the ascending trendline and is currently trading within a tight $200 dollar range along the $8,225 support which is also slightly above the 100-day MA.
At the same time, the 50 MA is also in the process of crossing above the 100-day MA.
If BTC falls below the bullish trendline at $7,984, a revisit to the $7,750 support could occur.
Again, a drop below the ascending trendline at $7,903 could drop BTC to the next support at $7,750 and $7,400.
A high volume breakout above the $8,476 (200-day MA) could extend BTC price toward $9,000.
Bitcoin price in Telegram @btc_price_every_hour
Lendroid Support Token (LST) на Currencies.ru
$ 0 (+0.76% )
Объем 24H $0
Изменеия 24h: 5.17 % , 7d: -58.34 %
Cегодня L: $0 - H: $0
Капитализация $0 Rank 99999
Цена в час новости $ 0.00433573 (-100% )
|
|