2022-9-9 10:30 |
Bitcoin (BTC) has possibly begun a bullish reversal with an impressive increase on Friday. The shape of the ongoing increase will be crucial in confirming this possibility.
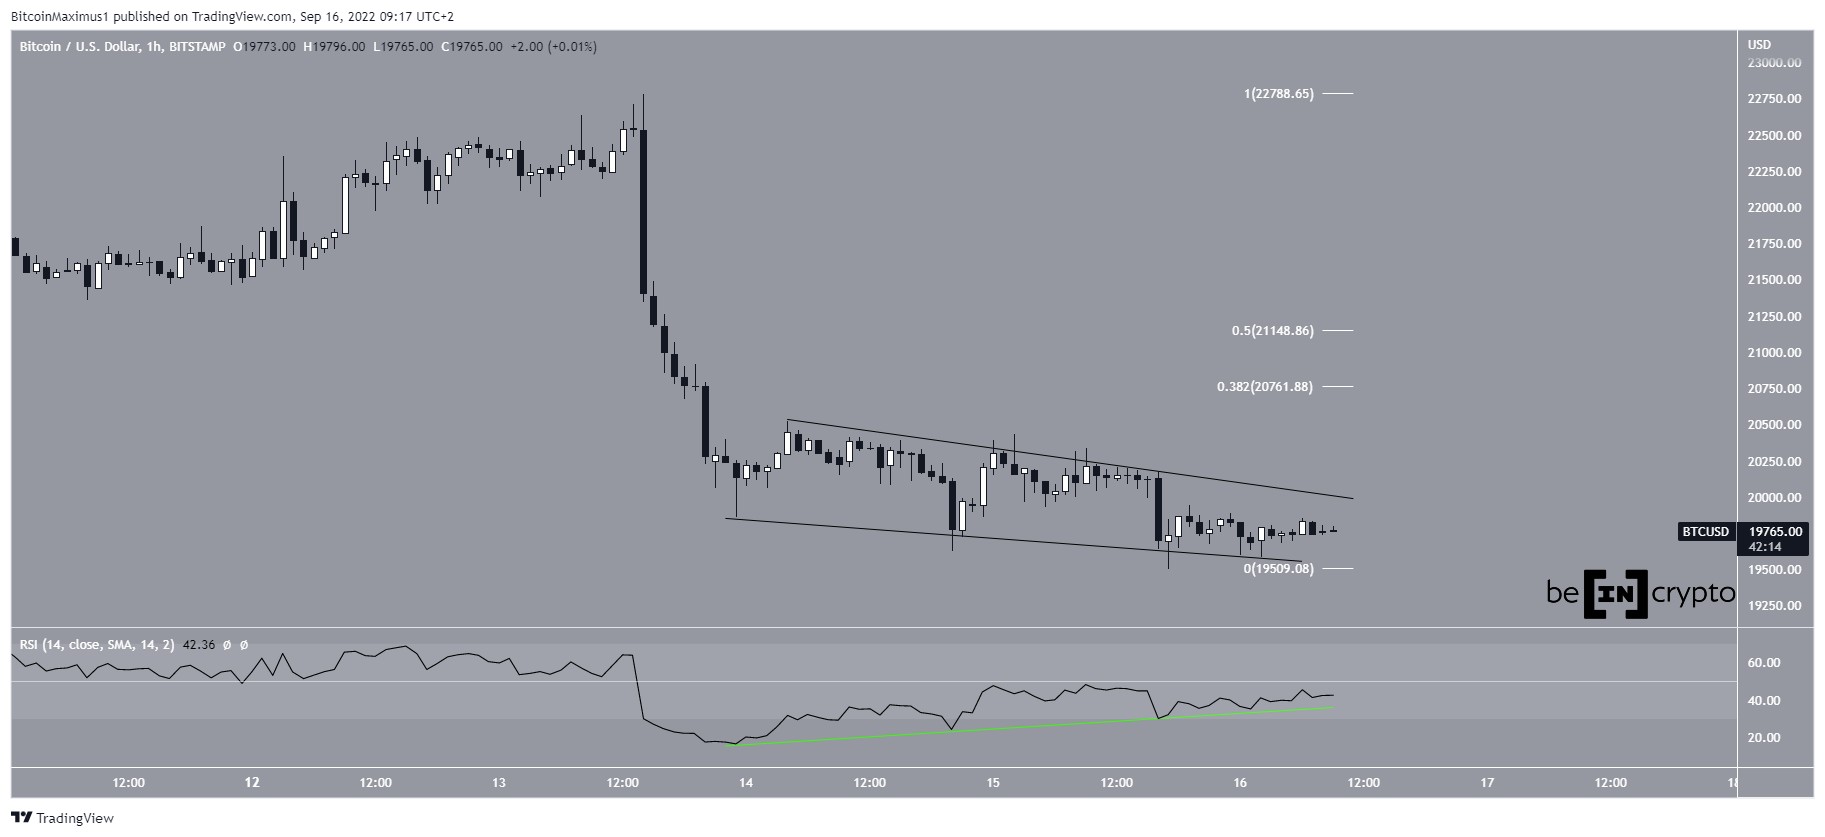
BTC has been increasing since bouncing at the $19,000 horizontal support area on Sept. 7 The upward movement was preceded by bullish divergence (green line) in the daily RSI.
The upward movement accelerated on Sept 9 and the price has now reached a high of $20,800. Currently, Bitcoin is facing resistance at $21,113, created by the 0.382 Fib retracement resistance level and the support line of the previous ascending parallel channel. Moreover, the daily RSI is facing resistance at 50.
A reclaim of this level would go a long way in suggesting that a bullish trend reversal has begun.
BTC/USDT Chart By TradingView Future movementThe six-hour chart shows that Bitcoin has broken out from a descending resistance line and validated it as support afterward (green icon).
Currently, it is trading just below horizontal and Fib resistance at $21,100.
The six-hour RSI has decisively broken out above 50 (green icon) for the first time since Aug 15. As a result, it is likely that Bitcoin will eventually break out from both these resistance levels.
BTC/USDT Chart By TradingView BTC wave count analysisSince the Aug 13 high, BTC has completed a five-wave downward movement (red) that ended with the $18,540 low on Sept 7.
Since then, the price has been increasing, in what could be an A-B-C corrective structure. If so, it is currently in wave A. The upward movement will continue towards the 0.5-0.618 Fib retracement resistance at $21,900 to $22,700.
In this possibility, the price will resume its downward movement after completing the current bounce.
BTC/USD Chart By TradingViewThe alternate possibility suggests that Bitcoin has begun a new bullish impulse instead and is now in wave one of that bullish impulse.
In this possibility, the price will break through the $21,900 to $22,700 resistance area and move towards new highs.
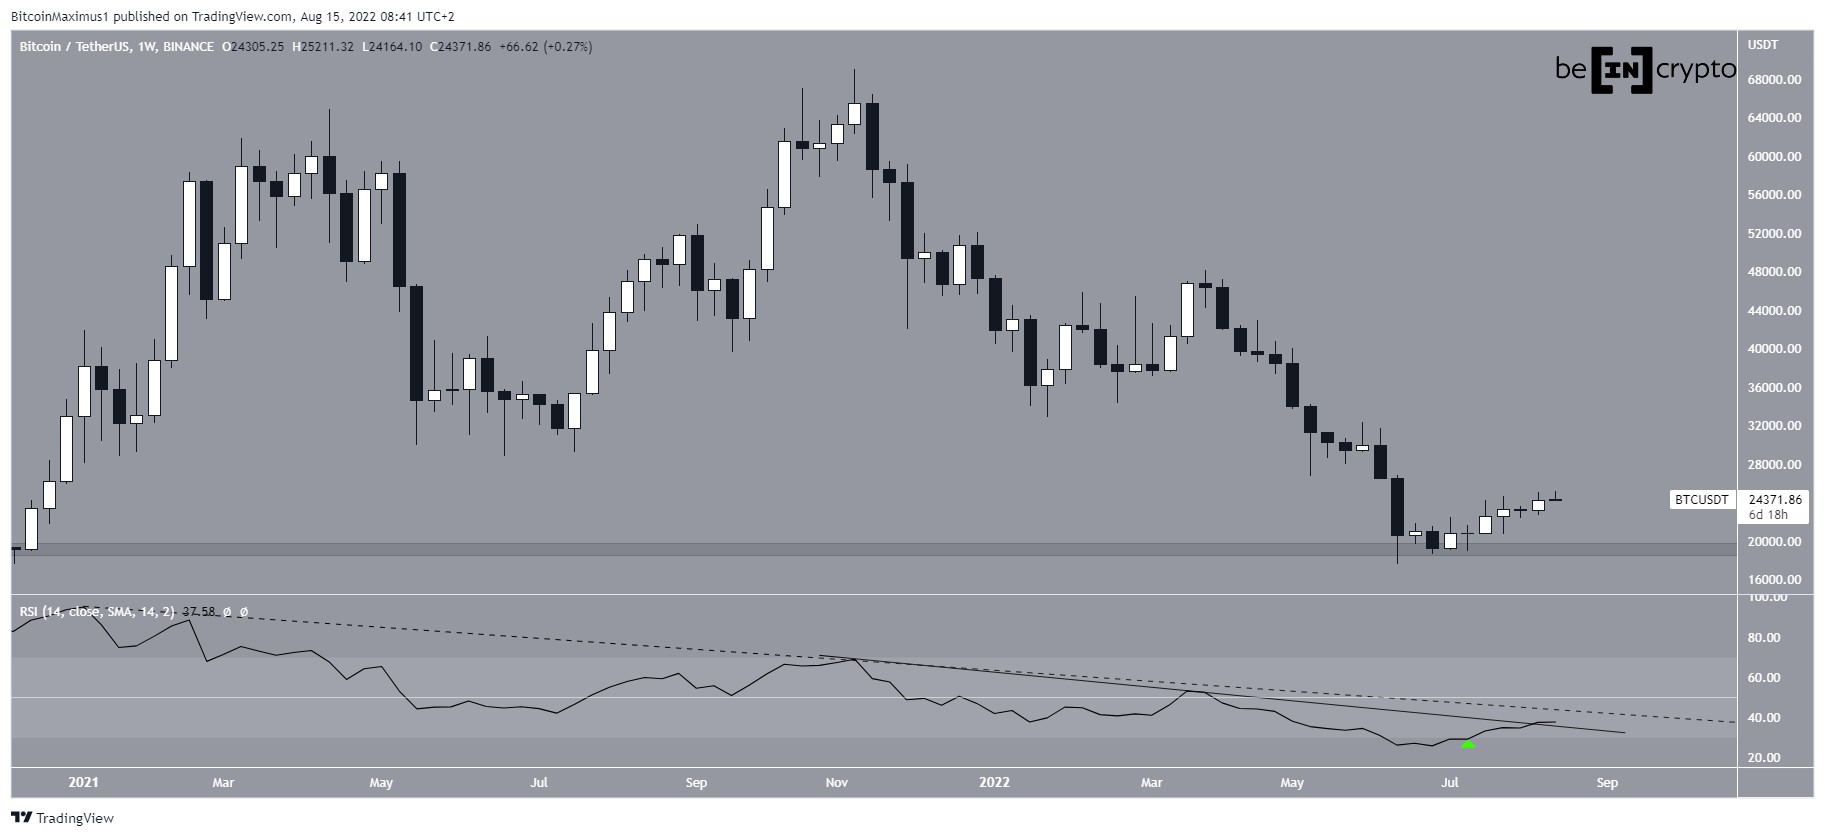
BTC/USD Chart By TradingViewThe wave count suggests that BTC is in the fifth and final wave of a downward movement (white) that began with the all-time high price in Nov.
If the previously outlined bullish count is correct (red), wave five was truncated and BTC has begun a bullish trend reversal.
If not, the preceding decrease was only wave one of a five-wave downward movement (black), and BTC will continue to $15,420 or $12,770. The targets are found using the 1.27 and 1.61 external Fib retracement levels of wave four (white).
The shape of the ongoing bounce will be crucial in determining which is the correct count moving forwards.
BTC/USD Chart By TradingViewFor Be[in]Crypto’s previous Bitcoin (BTC) analysis, click here
The post Bitcoin (BTC) Pushes Past $20,000 – Has a Bullish Reversal Begun? appeared first on BeInCrypto.
origin »Bitcoin price in Telegram @btc_price_every_hour
Bitcoin (BTC) на Currencies.ru
|
|


