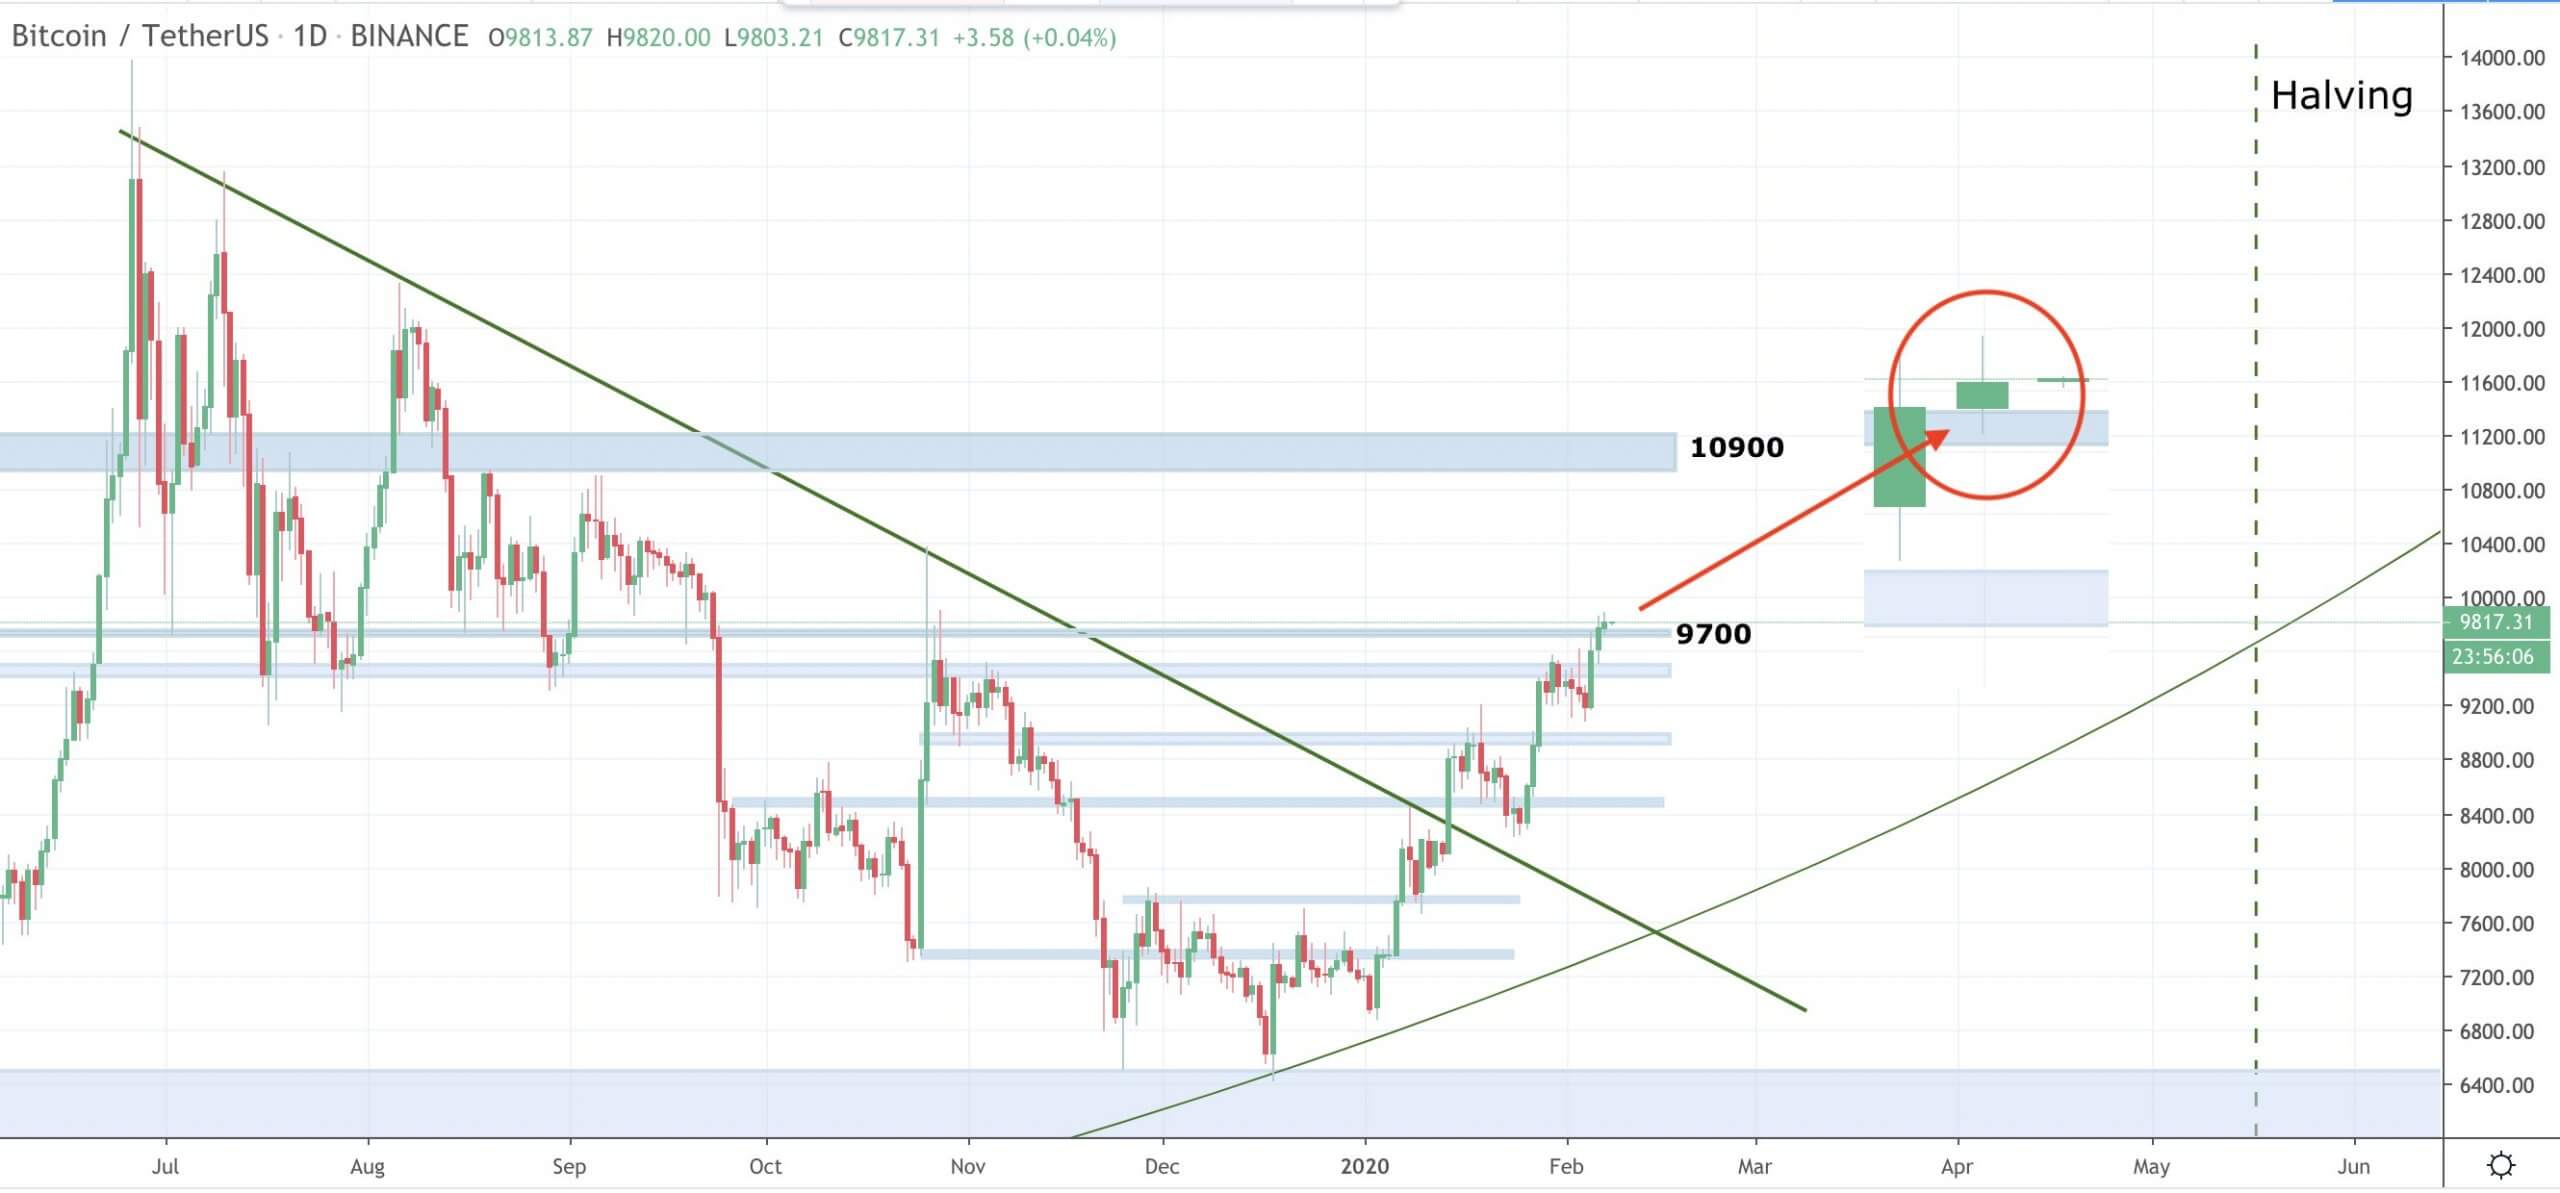
Bitcoin climbed higher on Tuesday following two weeks of flat price action.
The jump led its price closer to retesting a classic resistance trendline with origins dating back to December 2017.
A recent fractal shows the tendency of traders to test $10,000-$10,5000 following a close above the said trendline.
Bitcoin may jump above $10,000 in the coming sessions, according to a historically convincing technical setup.
In retrospect, the benchmark cryptocurrency broke out of its narrow trading range on Tuesday. It established an intraday high at $9,438 on Coinbase crypto exchange, its highest level since July 9. The upside break came in the wake of a global market rally led by the European Union’s decision to aid its economy with a $2 trillion fiscal aid.
But as Bitcoin initiated its latest rally, the cryptocurrency also came closer to breaking above a classic “bull trap” area.
A Giant Resistance Line
Since December 2017, the BTC/USD exchange rate has been trading under a Descending Trendline, barring a few brief breakout attempts. The pair repeatedly tested the price ceiling – about twelve times – between May 4 until July 21. And now, entering the current daily session, it is making yet another attempt to close above it.
Bitcoin price consolidating inside a giant triangle. Source: TradingView.com
BTC/USD on Wednesday shed part of its intraday gains upon testing the Descending Trendline for a breakout. The pair fell modestly by 0.45 percent ahead of the London opening bell, once again showing resilience among traders to open new bullish positions near the Trendline.
Market analyst Josh Rager called it a “mid-range” setup. He noted that Bitcoin would likely trade between $10,000 and $8,500 without clarifying its directional bias. Even a close above $10,000 will appear “semi-euphoric,” given a historically high selling sentiment near the $10,500-level.
The independent analogy fits the Descending Trendline scenario. While Bitcoin may close above the trendline on an uplifting macro sentiment (vaccine, stimulus, etc.), it would stay bearish as long as it trades below $10,500. As a result, the price would fall back below the Trendline.
“If [BTC/USD] goes back under $9,230 on a close, I’ll start to lean more bearish as this compression can’t last much longer,” asserted Mr. Rager.
Bitcoin Bull Case
As the market outlook remains neutral, some Bitcoin chart watchers believe it is time for the cryptocurrency to invalidate the Descending Channel.
Kyle Bass, the chief investment officer of Hayman Capital Management, said that Bitcoin would rally due to central banks’ expansionary policies. As more cash liquidity enters the economy, a portion of it would fly into both risky and risk-off assets, benefiting cryptocurrencies, as well as Gold, stocks, and silver.
“Silver, Gold, Bitcoin, etc all look to be ready to make explosive moves higher given the sheer amount of money printing going on around the world,” said Mr. Bass.
Dan Morehead, the co-CIO of Pantera Capital, also cited the US’s increasing budget deficit as one of the main reasons why Bitcoin will rally. Excerpts:
“Now that we’re in the trillions, the deficit just simply has to have a positive impact on the price of things not quantitatively-easable — stocks, real estate, cryptocurrency relative to the price of money. Said another way, the BTC/USD cross-currency rate will rise.”
Bitcoin was trading 0.63 lower at $9,334 at the time of this writing. origin »
Ethereum’s price has been sliding lower over the past several days Despite Bitcoin being able to maintain above the lower boundary of its long-held trading range, ETH is now trading firmly below the range it formed over the past several weeks This points to some underlying weakness amongst its buyers which comes as it nears its crucial $220 support level It also just confirmed a “death cross” formation that hasn’t been seen since March. This […]
Bitcoin is flashing some signs of weakness as it navigates towards the lower boundary of a trading range that has been firmly established over the past couple of weeks The crypto’s current weakness comes after a failed attempt by buyers to propel it towards $10,000 This decline has also led BTC down to a multi-month ascending trendline that has been guiding its price higher If it breaks below this level, analysts warn that it could […]
Bitcoin’s halving was accompanied by high levels of volatility as many prominent analysts within the industry expected. The flagship cryptocurrency took a 20% nosedive over the weekend that saw its price drop below $8,000.
In the long-term logarithmic Bitcoin price chart, it is possible to draw a curved trendline that has acted as a support line since 2011. The recent decrease served to validate this line for the tenth time in BTC history.
While a long-term price indicator has flipped bullish, bitcoin is struggling to gather upside traction and looks vulnerable near the seven-week rising trendline support.
Bitcoin (BTC) ended the day on a high note, with the cryptocurrency closing its daily candle above a key support level, eluding to the possibility that it will now begin its ascent to its next critical resistance region.
Stellar Lumens recently moved above a downward trendline that was holding its price from a further advance for the past two years. Closing the week above this significant price hurdle could be the catalyst for a bull rally.
XRP just broke above a significant price hurdle that has been containing its price from advancing further since January 2018. Now, this cryptocurrency could be preparing to make higher highs. XRP breaks decisively through resistance After reaching an all-time high of $3.
#Bitcoin price bounces back over the $8,000 mark, allowing traders to set their sights on the $8.6K to $9.2K zone but first bulls need to press above the 200-DMA and descending channel trendline
Bitcoin price has been trapped within a powerful downtrend that’s cut the leading cryptocurrency by market cap’s value by nearly 50% over the course of the last few months. Coinciding with the downtrend, Bitcoin’s Relative Strength Index has been confined below a decreasing trendline that the cryptocurrency has now broken out of, suggesting that a... The post appeared first on NewsBTC.
Ripple has a bearish short-term and medium-term trading outlook The four-hour time frame shows that a bearish head and shoulders pattern has been triggered The daily time frame continues to show Ripple testing long-term trendline support Ripple has moved to test long-term trendline support below the $0.
Ether price needs to break above the long term descending trendline and stiff resistance at $150 in order to break the multi-week pattern of lower highs
Monero has a bearish short-term and medium-term trading bias The four-hour time frame shows that a bullish inverted head and shoulders pattern has been triggered The daily time frame shows the cryptocurrency has bounced from major trendline support Monero has posted double-digit gains following a strong bullish reversal from $45.
Bitcoin (BTC) has continued to consolidate around its key near-term support at $8,000 and both its bulls and bears have remained deadlocked as it fails to gain any decisive momentum in the time since its recent drop down to its current price levels.
The Bitcoin price has made a triple bottom inside the support area at $8650, combined with long lower wicks. While this is a bullish pattern, the bullish divergence trendline in the RSI has been broken.
Ripple has a bearish short-term and short-term trading bias The four-hour time frame shows that a bearish trendline break has occurred The daily time frame is showing that a valid inverted head and shoulders pattern remains in play Ripple is back under heavy downside pressure, following a sustained bearish breakdown under the psychological $0.
Dash has a bullish short-term trading bias, but still remains bearish over the medium-term The four-hour time frame shows a bullish inverted head and shoulders pattern The daily time frame highlights a long-term rising trendline as a possible bullish target around the $113.
Major support zone: $15. 30 Major resistances: downsloping trendline at $17. 25 and confluence of two Fibonacci levels at $21. 19 Upside potential: breaking the declining trendline and reaching the first resistance at $21.
Bitcoin Cash is trading down around twenty percent from its weekly opening price The BCH / USD pair is testing a major long-term trendline on the daily time frame The recent drop has created bullish MACD divergence extending towards the $290.
IOST has a bearish short-term trading bias, with the cryptocurrency still trading below major technical support on the four-hour time frame The four-hour time frame shows that the IOST / USD pair is holding above key trendline support The daily time frame continues to show a bearish wedge breakout in progress IOST / USD Short-term […]
The post IOST Price Analysis IOST / USD: Not Enough Power appeared first on Crypto Briefing.
The short-term is in the uptrend while the medium-term outlook is in a downtrend. Traders may look to sell at trendline area in the medium-term REP/USD Medium-term Trend: Bearish Supply zone: $20. 00, $22.
The short and medium-term outlook is in the downtrend. Readers may consider selling at key area. LSK/USD Medium-term Trend: Bearish Supply zone: $3. 00, $3. 50, $4. 00 Demand zone: $2. 00, $1. 50, $1.
Over the last 7 Days, Ethereum has clearly bounced three times off rising trendline support formed as a result of the most recent uptrend. This is a good sign that price levels will hold the uptrend and continue to rise throughout July.
The short-term is in a bullish trend while the medium-term outlook is in a downtrend. Responsible buying to the trendline may be considered in the medium-term. REP/USD Medium-term Trend: Bearish Supply zone: $20.
The bulls are in control of the short and medium-term outlook. Responsible buying at the key area is recommended. MKR/USD Medium-term Trend: Bullish Supply zones: $800. 00, $850. 00, $900. 00 Demand zones: $300.
By CCN Markets: In the past four days, the bitcoin price has increased from $7,630 to $8,240 by nearly eight percent against the U. S. dollar as other major crypto assets such as Ethereum and Litecoin recorded large gains.
The bears are in control of the short and medium-term outlook. Trader may consider selling after retest of the broken trendline. MKR/USD Medium-term Trend: Bearish Supply zones: $800. 00, $850. 00, $900.
The long-term outlook is in a bearish trend. Traders should wait for a break of the trendline to join the downward price movement. ZEC/USD Long-term Trend -Bearish Supply zone: $120. 00, $140. 00, $160.
4H ETHBTC ETHBTC ratio has remained intact – ETH has regained months of lost value in only two days during its mid May rally. ETH broke above the descending trendline and hit Fib382 (0. 0353 BTC) of the most January high and recent May low.
Daily ETHBTC ETHBTC ratio has remained intact – ETH has regained months of lost value in only two days during its mid May rally. ETH broke above the descending trendline and hit Fib382 (0. 0353 BTC) of the most January high and recent May low.
Daily ETHBTC ETHBTC has remained intact – ETH has regained months of lost value in only two days and the impulsive jolt up still looks like it still hasn’t run out of fuel. ETH broke above the descending trendline and hit Fib618 (0.
Mid May Update: Technicals Daily ETHBTC ETHBTC has remained intact – ETH has regained months of lost value in only two days and the impulsive jolt up still looks like it still hasn’t run out of fuel.
Mid May Update: Technicals Daily ZILBTC The falling wedge pattern played out as expected, we saw a mild breakout and Zilliqa jumped up by 50 sats. Right now, Zilliqa needs to climb up above the falling trendline at 255-260 sats and close above it so we can have a stronger signal of a bull run.
Mid May Update: Technicals Daily ENJBTC On the daily chart, ENJ is really trying to penetrate the down-slanting trendline and officially end the intermediate bearish trend after it defended the bottom at 1671 satoshis.
Mid May Update: Technicals 4H NEOBTC The 4H chart shows NEO dancing around a crucial height of 149k which is a junction point of EMA20 and falling trendline of April. Closing a daily candle above the breakout zone of 157k at Fib236 (April-May high lows) and Fib786 (recent May highs and lows) would be a […]
The post Neo (NEO) Price Prediction for 2019 and Beyond – Hovering Around Crucial Height Searching For Volume Uptick (Mid May Update) appeared first on CaptainAltcoin.
Mid May Update: Technicals Daily ZILBTC The falling wedge pattern played out as expected, we saw a mild breakout and Zilliqa jumped up by 50 sats. Right now, Zilliqa needs to climb up above the falling trendline at 245-250 sats and close above it so we can have a stronger signal of a bull run.
Chainlink is bullish in the short-term, with the LINK / USD pair advancing to a new 2019 trading high The bullish inverted head and shoulders pattern has now been triggered across the four-hour time frame The daily time frame is showing that the cryptocurrency has now broken above major trendline resistance Chainlink / USD Short-term […]
The post Chainlink Price Analysis LINK / USD: Mainnet Euphoria appeared first on Crypto Briefing.
Mid May Update: Technicals As charted last time, LTCUSDT did break out upwards and is now back above the ascending trendline it formed way back in January 2019. Fibonacci 786 and uptrend line are forming a strong support at $82.
Mid May Update: Technicals ADA had a tough April and begining of May – it dropped through the ascending trendline that acted as the support and then penetrated another horizontal support line at 1087 satoshis, a strong zone formed back in January 2019, defended and used as the rebound area on multiple ocassions in January […]
The post Cardano (ADA) Price Analysis and Prediction for 2019 – Time To Reclaim The Lost Ground (Mid May Update) appeared first on CaptainAltcoin.
Mid May Update: Technical Analysis Electroneum has managed to temporarily stop the slide into nihility and broke through the down pulsing trendline, but then the drift continued. It also seems to have invalidate the support zone around this 85-87 satoshis level and it is now in no men’s land – reaching absolute rock bottom at […]
The post Electroneum (ETN) Price Prediction 2019 – Who Will Deliver An Eulogy? (Mid May Update) appeared first on CaptainAltcoin.
Mid May Update: Technicals BNBUSDT makes up 46% of Binance coin trading and the weekly chart faces some struggles after a long time of steep ascent. As you can see below, BNB invalidated the ascending trendline on the weekly and then bounced off of he first support at $19.
Mid May Update: Technicals DOGEBTC has broken a long-term bullish trendline on the weekly chart and the price currently rests at the ultimate support zone of 38 sats. Considering that market is completely focused on bitcoin’s fight with the newly acquired heights, altcoins are rotting on the racks and waiting for their season to commence.
Mid May Update: Technicals LINKBTC looks very good on the daily timeframe. Link managed to break the EMA200 and two resistances: horizontal at 9473 sats and ascending trendline at 10330; it is now testing the Fib 618 level and will probably take a breather here before marching further to the 12477 satoshis level and Fib […]
The post ChainLink (LINK) Price Analysis and Prediction 2019 – All Bullish Confirmations You Can Hope For (Mid May Update) appeared first on CaptainAltcoin.
Early May Update: Technicals BNBUSDT makes up 46% of Binance coin trading and the weekly chart faces some struggles after a long time of steep ascent. As you can see below, BNB invalidated the ascending trendline on the weekly and it is now floating around the first support at $19.
Early May Update: Technical Analysis Electroneum has managed to temporarily stop the slide into nihility and broke through the down pulsing trendline, but then the drift continued. It also seems to have invalidate the support zone around this 85-87 satoshis level and it is now in no men’s land – reaching absolute rock bottom.
Bitcoin price is consolidating above the $95,000 support zone. BTC must settle above the $100,000 level to start a fresh increase in the near term. Bitcoin started a fresh increase from the $94,200 zone.
Bitcoin price started a fresh upward move above $100,000. BTC is facing resistance at $103,000 and might aim for an upside break. Bitcoin started a decent upward move above the $100,000 zone. The price is trading below $103,200 and the 100 hourly Simple moving average.
Bitcoin price settled above the $100,500 resistance zone. BTC is consolidating gains and might aim for a fresh increase above the $105,000 zone. Bitcoin started a downside correction from the $106,800 zone.
Bitcoin price started a short-term downside correction from the $106,250 zone. BTC is consolidating above $100,000 and might aim for a fresh increase. Bitcoin started a downside correction from the $106,250 zone.