2020-5-12 03:20 |
The prices of both Bitcoin (BTC) and the S&P 500 (SPX) have been increasing since they reached a bottom on March 13 and 23, respectively.
While they have moved in the same direction, their rate of increase has not been the same, with BTC increasing at a faster rate. Well-known trader @ColdBloodShill tweeted an image that shows the price of both BTC and SPX side by side and their respective differences in the rate of increase.
Source: TwitterHe believes the BTC price will go down, while SPX will increase.
There have been multiple occasions where we’ve seen inverse reactions in the PA before the gap is closed between $BTC and $SPX (red).
Let’s take a closer look at the prices of both BTC and SPX in order to determine where they will head to next.
S&P 500The SPX price has been increasing since March 23, when the price reached a low of $2,177. Since then, the index has recovered the majority of its losses, increasing by 35%.
However, the price has been twice rejected at the $2,950 resistance area, which is the:
0.618 Fib level of the entire decrease. Previous support area turned resistance. 200-day moving average (MA).Therefore, until the price is able to successfully move above this level, the price movement is considered bearish.
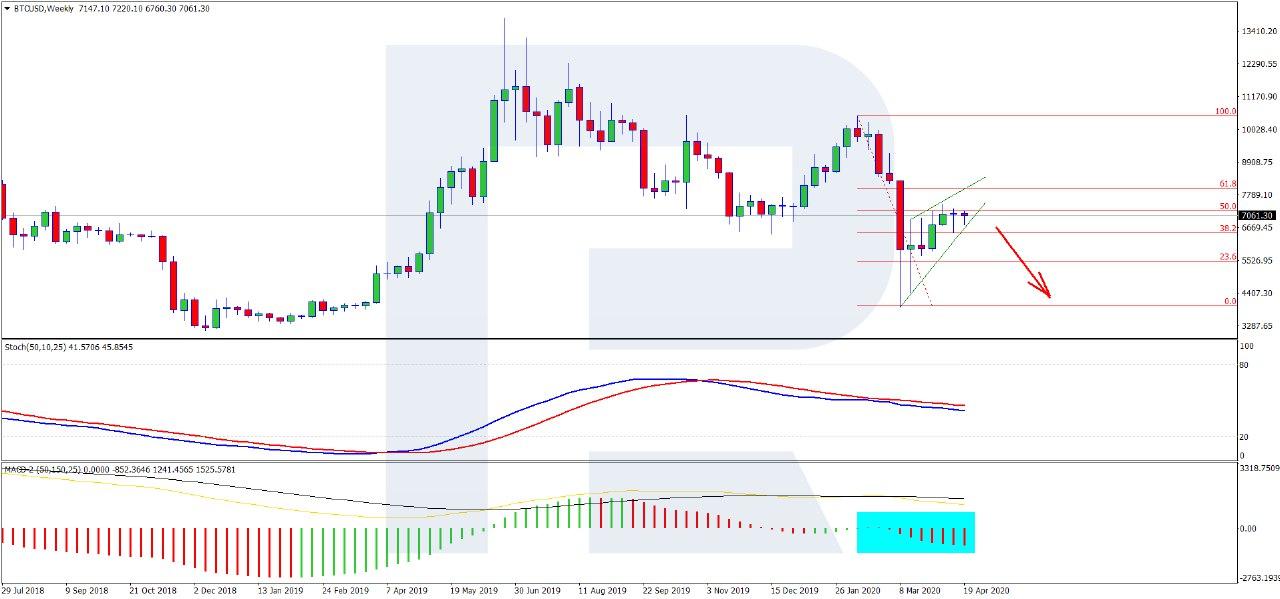
S&P 500 Chart By Trading View BitcoinThe Bitcoin price has been following an ascending support line since it reached a bottom on March 13. However, it reached a top on May 7 and has been decreasing since. At the time of writing, the support line was at $8,000, a support level also strengthened by the presence of the 200-day MA.
We went into more detail about the Bitcoin price movement in this article.
Bitcoin Chart By Trading View ComparisonThe price of both BTC (blue) and SPX (red) are shown in the chart below. Indeed, since both assets reached a bottom in March, their prices have been positively correlated with each other. However, there have been periods of divergence, followed by a retracement to the mean and a subsequent flip.
Therefore, the price of BTC initially increased at a much faster rate than SPX (first blue arrow), only to drop sharply and be surpassed by SPX (red arrow).
The price of BTC surpassed that of SPX once more on April 23 and has been increasing at a much faster rate since. If the pattern continues to hold true, as SPX increases towards $2,950, BTC will decrease towards $8,000 in order to cause another cross. This fits with our BTC support area, which is found near $8,800.
S&P 500 Chart By Trading ViewTo conclude, while the BTC and SPX prices have been correlated since the March bottom, their rates of increase have diverged and converged several times until now. If the pattern continues, BTC will decrease towards $8,000 while SPX increases towards $2,950.
The post Bitcoin Has Increased at a Faster Rate Than the S&P 500 appeared first on BeInCrypto.
origin »Bitcoin price in Telegram @btc_price_every_hour
Bitcoin (BTC) на Currencies.ru
|
|