XRP Tanks Following Hyped Airdrop That Catalyzed Parabolic Rally

2020-12-13 02:00

XRP has given up a serious percentage of its recent gains, with the cryptocurrency’s parabolic rally fading and showing few signs of strength as sellers rise with full force.

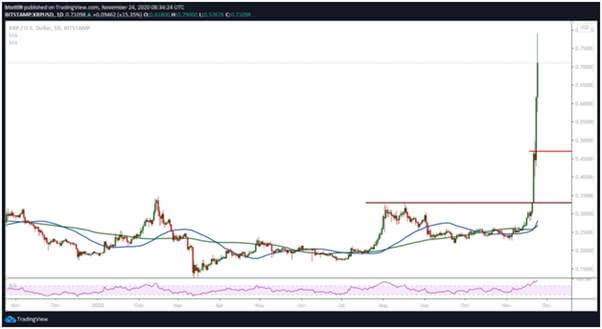
The cryptocurrency’s parabolic rally came about shortly after it plunged to lows of $0.23 before rallying to the top of its multi-year trading range around $0.30. The break above this level came about swiftly and allowed it to see some immense momentum.

Adding fuel to this sharp price rise was mounting hype surrounding the airdrop distributed to XRP investors yesterday, which was widely thought to have the potential to provide holders with some valuable tokens – similar to the airdrop seen by Uniswap.

This created a buying frenzy that boosted XRP’s technical strength and ultimately led it to highs of $0.90 on Coinbase, at which point it lost its momentum and began reeling lower.

It has been unable to gain any strong momentum in the time since and is still flashing some signs of weakness as bulls struggle to maintain its recent momentum.

One analyst is pointing to this latest rally and noting that it is structurally similar to those seen in years past that have always resulted in full retraces.

XRP Plummets Following SPARK Airdrop

At the time of writing, XRP is trading down nearly 6% at its current price of $0.50, which appears to be a support level for the token.

It does appear that the airdrop was a “sell the news” event, as it started reeling lower right around the time of which the SPARK snapshot was taken of XRP balances on platforms that are supporting it.

Because the crypto is now showing signs of technical weakness, it could be a matter of time before it drifts back towards its multi-year trading range.

Trader Claims Latest Pump is Structurally Similar to Previous Ones

While sharing his thoughts on where XRP might trend in the mid-term, one trader noted that the cryptocurrency’s latest rally is shaping up to be just like all the others.

This means that it may see a swift decline in the days and weeks ahead as traders take profits on this movement.

“Whole lot of noise about XRP the past few days for a chart that’s slowly filling it’s inefficiency like it’s done every time in the past.”

Image Courtesy of Chase_NL. Source: XRPUSD on TradingView.

Regardless of where Bitcoin and Ethereum trend in the mid-term, there’s a strong possibility that XRP will see serious losses as long-term investors use this rally as an exit opportunity.

Featured image from Unsplash. Charts from TradingView.

Similar to Notcoin - TapSwap on Solana Airdrops In 2024

origin »

Rally (RALLY) на Currencies.ru

$ 0.0004604 (+0.00%)
Объем 24H $0
Изменеия 24h: 0.00 %, 7d: 0.00 %
Cегодня L: $0.0004604 - H: $0.0004604
Капитализация $0 Rank 3603
Доступно / Всего 0 RALLY

parabolic rally xrp cryptocurrency rise full force

parabolic rally → Результатов: 126


Ethereum Could Be Weeks Away From a 400% Parabolic Rally; Levels to Watch

Ethereum has been closely tracking Bitcoin and the aggregated crypto markets over the past several days, which means that ETH’s multi-day price action has primarily favored sellers. In spite of this, ETH is still trading up significantly over a weekly period, and the cryptocurrency has been able to build some short-term momentum today, allowing it... The post appeared first on NewsBTC.

2020-1-22 00:00


Bitcoin Breaking This Single Level Will Spark a Parabolic 800% Rally

Bitcoin’s 2020 uptrend has drastically shifted the market structure of BTC, which was previously shaping up to be incredibly bearish while it was hovering within the $6,000 region. The subsequent rallies from this price region, however, have allowed it to climb all the way up to $9,200, which appears to be a key resistance level... The post appeared first on NewsBTC.

2020-1-21 00:00


Breaking This Line Could Cause Bitcoin to Turn Parabolic and Rally 1000%

It is beginning to look increasingly as though Bitcoin’s (BTC) recent rally from its early-January lows of $6,800 to its recent highs of $8,900 is much more than a fleeting relief pump. BTC bulls have been able to hold the crypto within the upper-$8,000 region for the past day, signaling that buyers currently have enough... The post appeared first on NewsBTC.

2020-1-16 00:00


Gigantic Ethereum Buy Wall May Be Enough to Spark a Parabolic Rally

Ethereum has been closely tracking Bitcoin’s volatile price action as of late, which head led ETH to gain a firm position within the $140 region. The cryptocurrency’s bulls have shown signs of growing vitality over the past several days, which comes as the altcoin market begins flashing hints of having immensely bullish near-term potential. It... The post appeared first on NewsBTC.

2020-1-13 01:00


Фото:

Bitcoin to Peak above $140,000 in Next Bull Market: Analysis

The next Bitcoin parabolic rally may take prices as high as $141,173, based on logarithmic band analysis. But the trek to those highs may take a while testing various support levels. Bitcoin Price Prediction Based on Previous Bands Charted Forward Analysis by Benjamin Cowen based this prediction on a backward look at BTC performance so far, especially in relation to the halvings of the block reward.

2019-12-21 14:55


Bitcoin Bear Flag Could Cause Crypto Asset To Retest February 2018 Lows

As the 2019 parabolic rally came to a close, Bitcoin began to trade within a large, multi-month descending triangle pattern that only just recently broke down after extensive consolidation. According to a popular crypto analyst, the breakdown resulted in Bitcoin forming a bear flag, and it likely signals further continuation to the downside, potentially as.

2019-10-16 02:00


Фото:

Has Bitcoin ‘Possibly’ Entered its 4th Parabolic Phase?

Few hours ago, in a tweet, acclaimed trader and analyst Peter Brandt hinted at bitcoin ‘possibly’ entering the next leg of its next/ fourth parabolic price rally. But, what really is his claim based on?  Retweeting a tweet from Raoul Pal, Founder/CEO – Global Macro Investor and Real Vision Group, Peter shared a BTC/USD chart which looks something as below.

2019-9-2 01:20


BitMEX exchange hits $1 trillion in Bitcoin trading volume following the parabolic advance of Bitcoin

The parabolic advance that started on April 2, caused a lot of FOMO, pushing the price as high as $13,800; the rally ended on June 26, and it has been a slow day ever since. BitMEX, one of the most famous leverage trading exchanges, known for its Bitcoin perpetual contract, surged with traders trying to […] The post BitMEX exchange hits $1 trillion in Bitcoin trading volume following the parabolic advance of Bitcoin appeared first on AMBCrypto.

2019-6-30 10:30