Technical Analysis: XRP at $0.79 after parabolic 150% rally

Technical Analysis: XRP at $0.79 after parabolic 150% rally
фото показано с : coinjournal.net

2020-11-24 15:06

XRP surged to highs of $0.79 amid a parabolic rally that could see bulls target $1.00 short term

With Bitcoin stabilising at around $18,400, altcoins like Ripple (XRP), Cardano (ADA) and Stellar (XLM) took the cue to rally higher.

XRP rallied more than 60% in 24 hours to see it trade as high as $0.79 against the US dollar. The mammoth upside took the cumulative weekly rally for the digital asset to over 150%, making XRP the best performer among top altcoins by a mile.

At the time of writing, bears are battling to claw back the gains, with XRP/USD now trading around $0.71.

XRP/USD

While a rally to $0.79 level remains the short term target, bulls will likely have to defend gains above $0.65 to remain on top. Otherwise, selling pressure may mean a retreat to $0.50 and possibly the long term $0.27 marked by the 100-SMA (weekly chart).

Looking ahead, the daily chart suggests the immediate resistance area is around $0.73. Above this, bulls will need to break to $0.75 and $0.79 (intraday high).

If bulls break above these levels, the 127.2% Fib retracement ($.093) and 141.4% Fib retracement ($1.00) provide the next barriers.

But with the RSI extended into overbought territory, a downside might be the path of least resistance. As such, the price might drop to the 78.6% Fib retracement level ($0.675) and then support at the 61.8% Fib level ($0.58).

Beneath this support area, bulls will look to absorb pressure at the 50% Fib retracement level ($0.52) and 38.2% Fib level ($0.46).

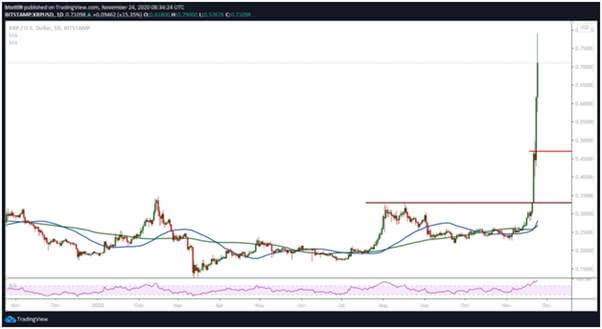
XRP/USD daily chart. Source: TradingView

On the weekly chart, XRP/USD has continued higher after breaking above a descending trendline and the 100-day simple moving average. If the price settles above the 78.6% Fibonacci retracement level ($0.65), a retest of the $0.79 resistance area is likely, with further gains taking prices to highs of $0.83 and then $0.95.

XRP/USD price weekly chart. Source: TradingView

However, the weekly RSI is overextended and increased panic buying could be followed by significant selling pressure.

If XRP fails to clear resistance at $0.73 and drops to $0.65, the likelihood of an extended downside correction could see XRP price settle around $0.52. From here, the next support is at $0.46, with the $0.33 level that had capped 2020 gains before the recent breakout providing another safer landing base for bulls.

Further down on the weekly chart, the 100-SMA ($0.27) and 50-SMA ($0.23) provide long term support levels.

The post Technical Analysis: XRP at $0.79 after parabolic 150% rally appeared first on Coin Journal.

origin »

Bitcoin price in Telegram @btc_price_every_hour

Ripple (XRP) на Currencies.ru

$ 1.3817 (+0.59%)
Объем 24H $2.975b
Изменеия 24h: 5.83 %, 7d: 1.92 %
Cегодня L: $1.3171 - H: $1.3853
Капитализация $84.843b Rank 4
Цена в час новости $ 0.6085 (127.07%)

parabolic rally xrp technical 150 analysis journal

parabolic rally → Результатов: 126


Ethereum Could Be Weeks Away From a 400% Parabolic Rally; Levels to Watch

Ethereum has been closely tracking Bitcoin and the aggregated crypto markets over the past several days, which means that ETH’s multi-day price action has primarily favored sellers. In spite of this, ETH is still trading up significantly over a weekly period, and the cryptocurrency has been able to build some short-term momentum today, allowing it... The post appeared first on NewsBTC.

2020-1-22 00:00


Bitcoin Breaking This Single Level Will Spark a Parabolic 800% Rally

Bitcoin’s 2020 uptrend has drastically shifted the market structure of BTC, which was previously shaping up to be incredibly bearish while it was hovering within the $6,000 region. The subsequent rallies from this price region, however, have allowed it to climb all the way up to $9,200, which appears to be a key resistance level... The post appeared first on NewsBTC.

2020-1-21 00:00


Breaking This Line Could Cause Bitcoin to Turn Parabolic and Rally 1000%

It is beginning to look increasingly as though Bitcoin’s (BTC) recent rally from its early-January lows of $6,800 to its recent highs of $8,900 is much more than a fleeting relief pump. BTC bulls have been able to hold the crypto within the upper-$8,000 region for the past day, signaling that buyers currently have enough... The post appeared first on NewsBTC.

2020-1-16 00:00


Gigantic Ethereum Buy Wall May Be Enough to Spark a Parabolic Rally

Ethereum has been closely tracking Bitcoin’s volatile price action as of late, which head led ETH to gain a firm position within the $140 region. The cryptocurrency’s bulls have shown signs of growing vitality over the past several days, which comes as the altcoin market begins flashing hints of having immensely bullish near-term potential. It... The post appeared first on NewsBTC.

2020-1-13 01:00


Фото:

Bitcoin to Peak above $140,000 in Next Bull Market: Analysis

The next Bitcoin parabolic rally may take prices as high as $141,173, based on logarithmic band analysis. But the trek to those highs may take a while testing various support levels. Bitcoin Price Prediction Based on Previous Bands Charted Forward Analysis by Benjamin Cowen based this prediction on a backward look at BTC performance so far, especially in relation to the halvings of the block reward.

2019-12-21 14:55


BitMEX exchange hits $1 trillion in Bitcoin trading volume following the parabolic advance of Bitcoin

The parabolic advance that started on April 2, caused a lot of FOMO, pushing the price as high as $13,800; the rally ended on June 26, and it has been a slow day ever since. BitMEX, one of the most famous leverage trading exchanges, known for its Bitcoin perpetual contract, surged with traders trying to […] The post BitMEX exchange hits $1 trillion in Bitcoin trading volume following the parabolic advance of Bitcoin appeared first on AMBCrypto.

2019-6-30 10:30


Bitcoin Correction Will Spawn New Parabola, Says Veteran Trader Peter Brandt

Bitcoin price took a surprising tumble after some inexplicable kerfluffle at BitMEX and traders are now wondering if the current rally has been compromised. Strong Correction Breaks Bitcoin’s Parabolic Advance Yesterday’s massive liquidation at BitMEX has the entire crypto-world up in arms and concerns about broken parabolas, fat fingers, wonky algos, and outright manipulation are setting every chatroom and journal on fire.

2019-5-18 23:00