2019-4-14 14:30 |
XRP/USD and XRP/BTC charts show a cycle that is being followed since April 2018. The first cycle started in April 2018 and ended in September 2018. The end of the cycle pushed the prices by a massive amount, which was followed by the start of the second cycle.
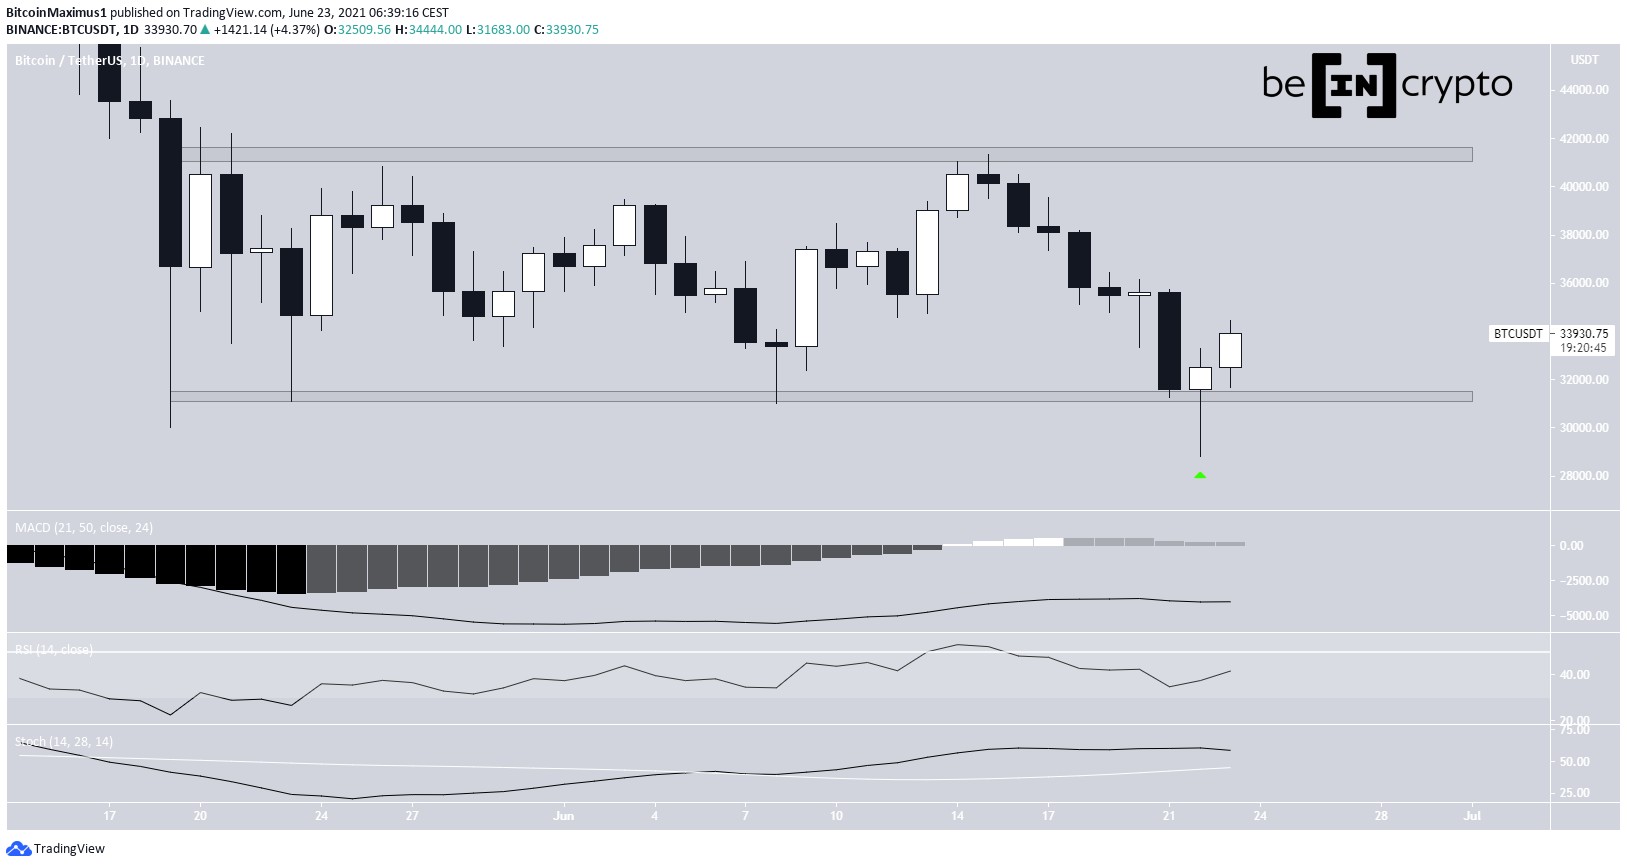
XRP/BTC Cycle 1Source: TradingView
The first cycle started after the price of XRP fell from its peak and the correction wave continued plummeting the prices by approximately 60%. The boom that followed the correction pushed the prices by 185% in approximately 10 days. The first cycle progressed in five steps, where the prices formed falling wedges with price breakouts at the end of each wedge.
As seen on the chart attached, the five steps were enclosed in a bigger falling wedge, which eventually broke out to the top.
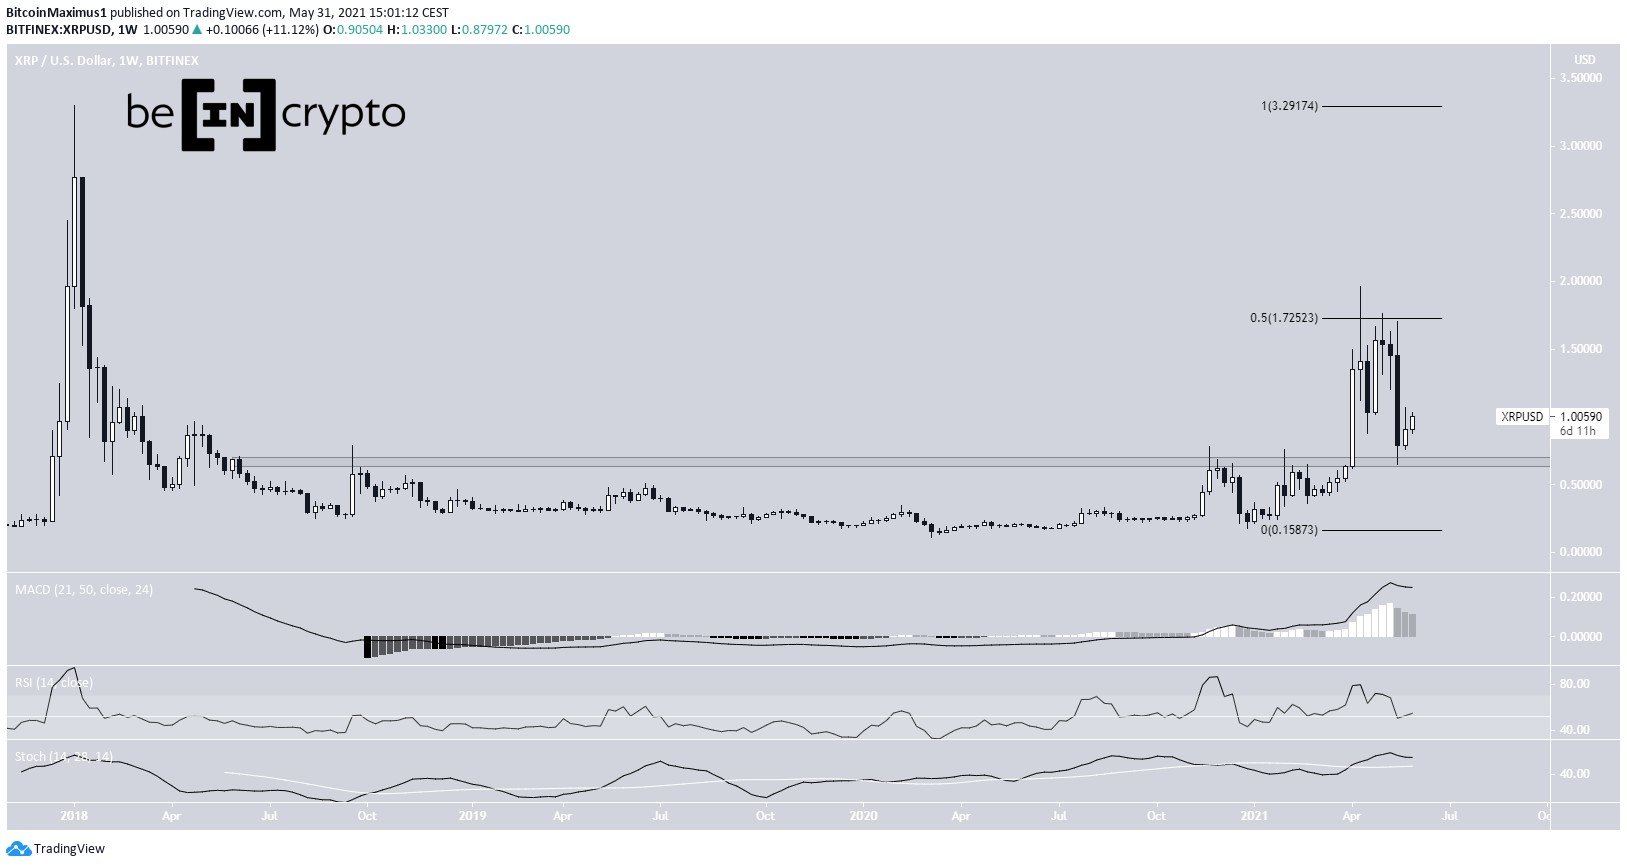
Cycle 2Source: TradingView
The second cycle is very similar to the first cycle; the prices falling in steps and completing four of the five steps, with each fall being in a falling wedge pattern.
In addition to the above, the patterns are exhibiting ~18% drop pattern, which is followed by a rise of ~22%. The fourth pattern dropped by ~22% and assuming the same, the prices in a short-term scenario would drop [by approximately 18% to 20%]. The drop could be immediate or could take a couple of days to manifest.
Source: TradingView
This final drop will be the fifth pattern, after which the prices will shoot up to the resistance at 0.0001042 BTC, which would be an increase of approximately 100%.
Source: TradingView
In addition to the above, the Stochastic RSI showcased that it still has room to move to the downside. As seen on the chart, there is a strong resistance at the 35-level.
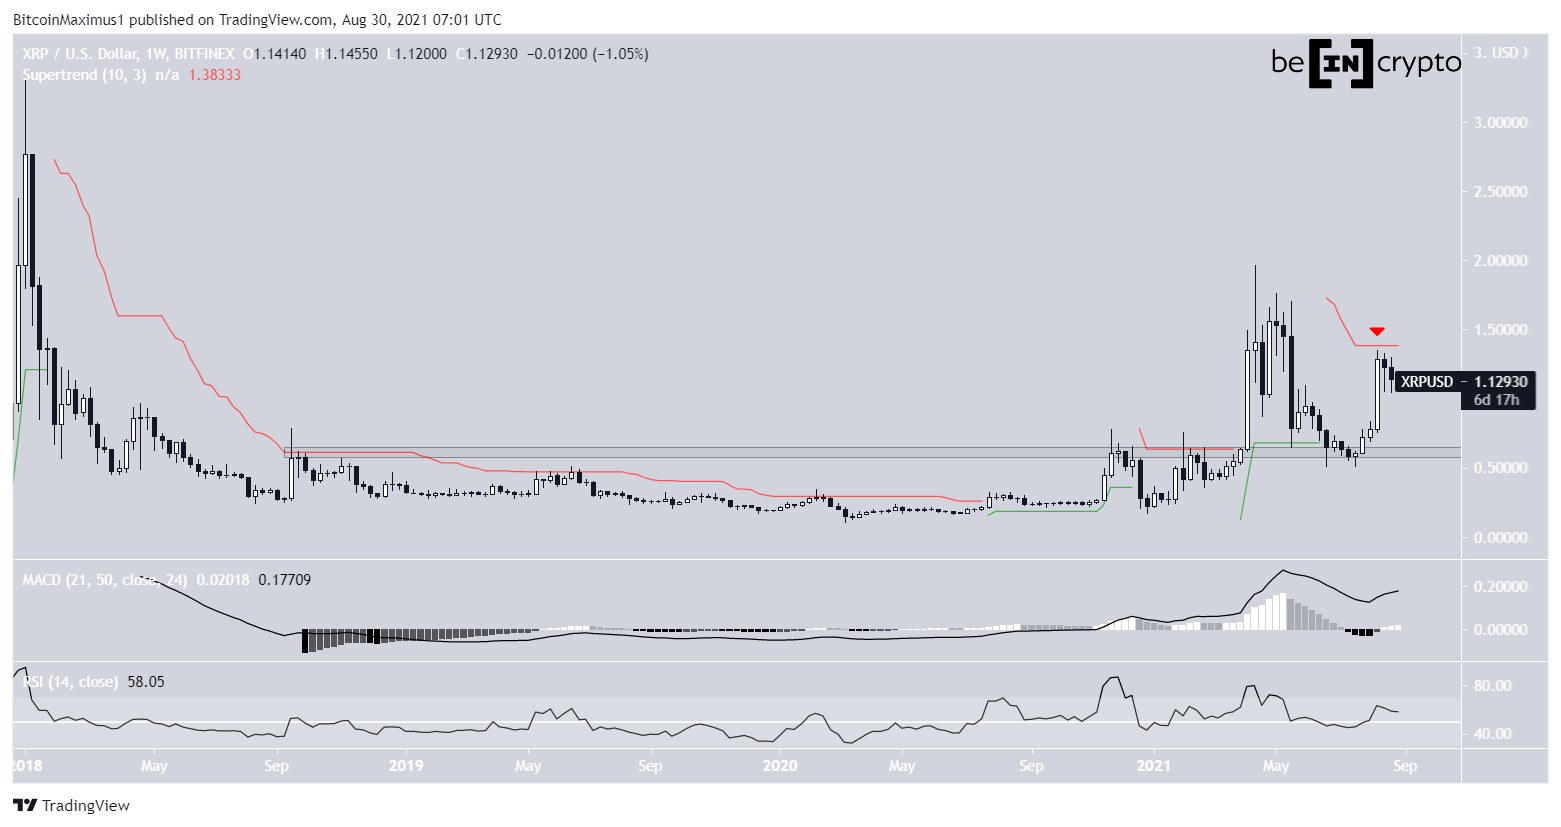
XRP/USDSource: TradingView
XRP paired against the US Dollar shows a bearish pattern over the course of 5-6 months. The descending triangle formed is accompanied by decreasing volume, further confirming the pattern.
In a relatively long time frame, the price of XRP seems to be heading lower. The breakout of the descending triangle will push the price of XRP as low as $0.1470 by the end of May 2019. The RSI shows that the price still has a lot of room to move to the oversold zone as it has only reached the 50-level, further confirming the downtrend for XRP.
ConclusionXRP/BTC chart shows that it will dump in a shorter time frame and then be followed by a massive pump. The XRP/USD chart showed exactly the same result as that of the XRP/BTC chart in the smaller time frame. XRP prices might reach as low as $0.14705 by the end of May 2019 or even sooner, but a short term drop is imminent.
The post XRP prices will fall and rise again from the ashes appeared first on AMBCrypto.
origin »Bitcoin price in Telegram @btc_price_every_hour
Ripple (XRP) на Currencies.ru
|
|