2021-8-30 13:56 |
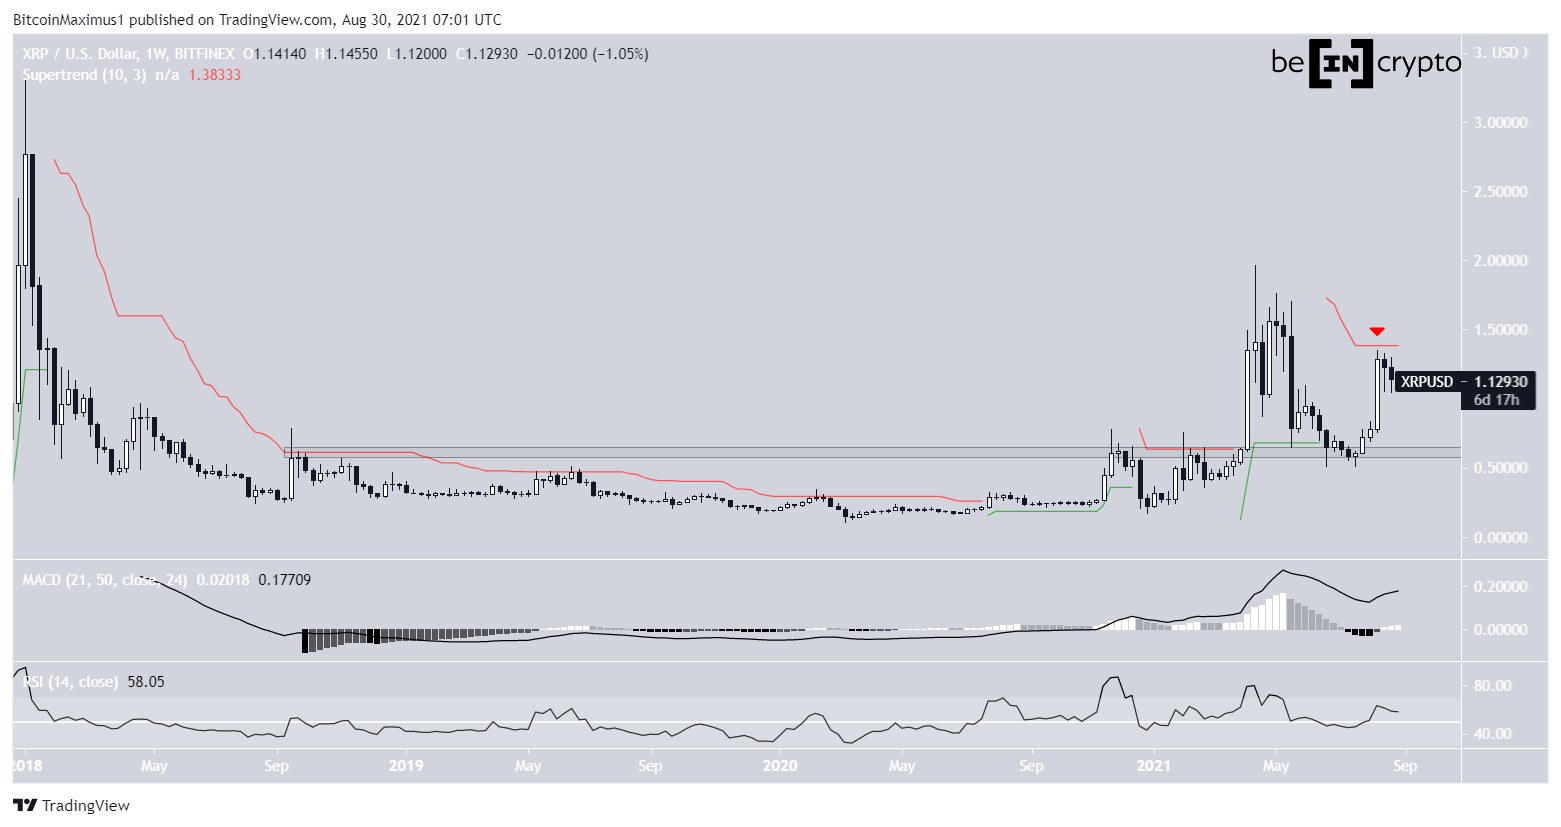
XRP (XRP) has been increasing since bouncing at the $0.62 long-term horizontal support area at the end of July.
It was rejected by a descending resistance line on Aug 29 and is now attempting to find short-term support.
XRP bounces at long-term supportXRP has been moving upwards since bouncing at the $0.62 horizontal support area at the end of July. So far, it has managed to reach a high of $1.35 on Aug 15. The token has been moving downward since.
Technical indicators are providing a mostly bullish outlook. The MACD and RSI are both moving upwards. The former is positive while the latter is above 50. However, XRP is facing resistance from the weekly supertrend line (red).
Moreover, XRP had been trading below the $0.62 support area since Sept 2018 before moving above it in April 2021. Therefore, as long as it is trading above this level, the long-term trend is considered bullish.
XRP Chart By TradingView Current resistanceThe daily chart shows that XRP has been following a descending resistance line since April 14. So far, it has been rejected by it five times, most recently on Aug 23 (red icon).
Both the daily MACD and RSI are decreasing, supporting the continuation of the downward movement.
Therefore, it seems that XRP is still searching for support after the ongoing rejection.
XRP Chart By TradingView Wave countCryptocurrency trader @AltstreetBet outlined an XRP chart, stating that the token has just completed a five-wave bullish impulse.
Source: TwitterThe movement since the July 20 low resembles a completed five-wave bullish impulse. If true, XRP is currently completing an A-B-C corrective structure, before potentially initiating another upward move.
The main support levels are found at $0.93 and $0.83, the respective 0.5 and 0.618 Fib retracement support levels.
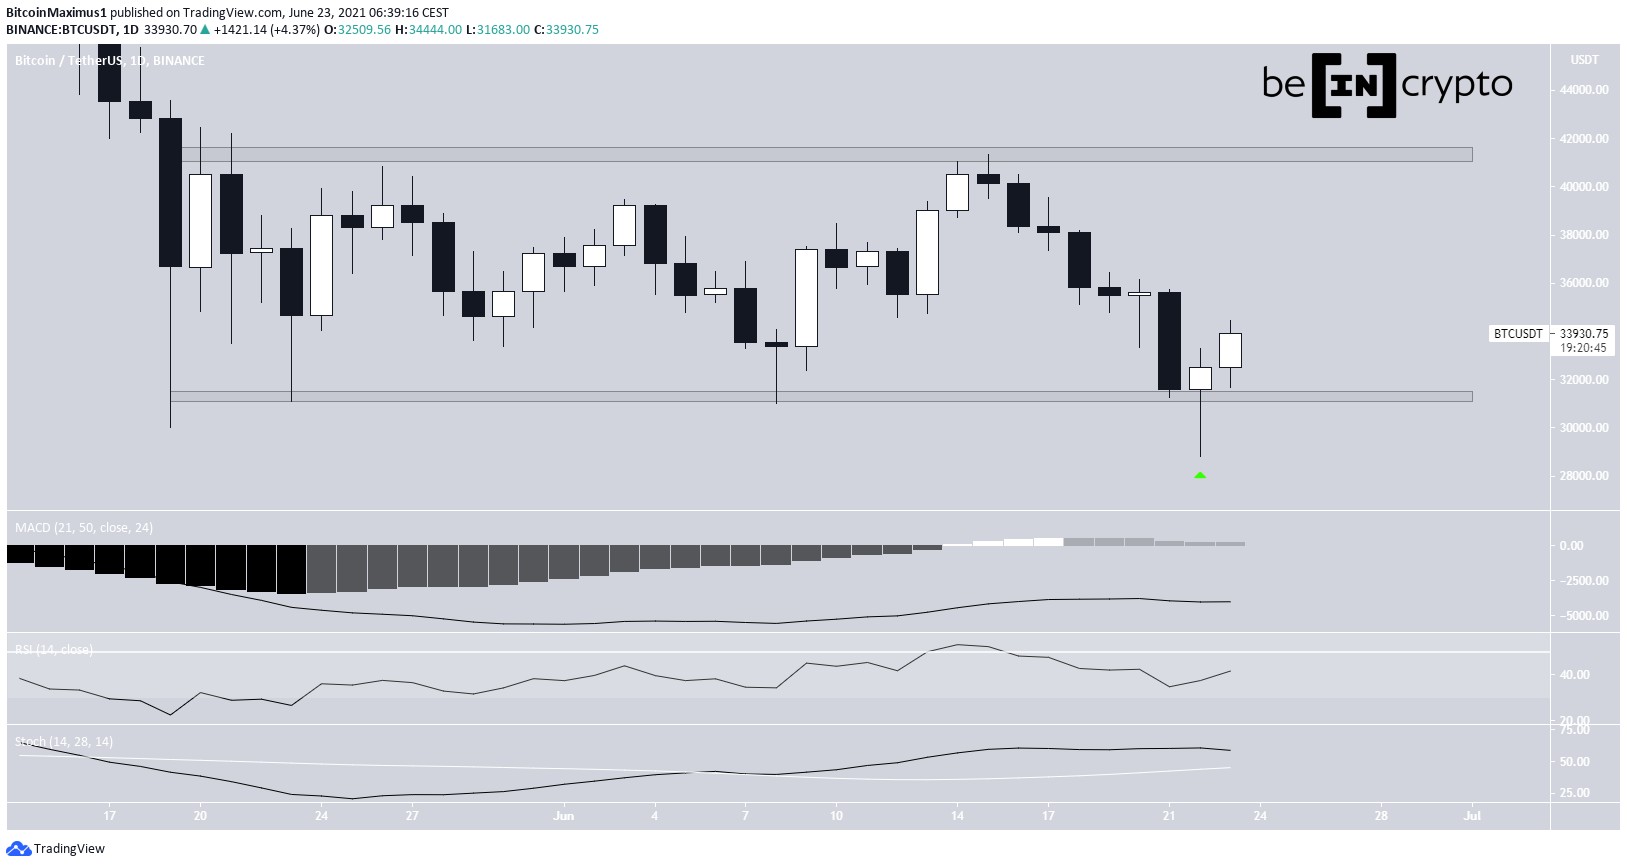
XRP Chart By TradingViewFor BeInCrypto’s latest Bitcoin (BTC) analysis, click here.
The post XRP Searches for Support After Rejection from Resistance appeared first on BeInCrypto.
origin »Bitcoin price in Telegram @btc_price_every_hour
Lendroid Support Token (LST) на Currencies.ru
|
|


