2020-5-13 07:20 |
In the beginning of May, both the XRP/USD and XRP/BTC pairs broke down from important support levels, possibly indicating that the previous upward trend has ended.
While the XRP/BTC price had been previously showing signs of weakness, the XRP/USD decrease was more unexpected, possibly occurring as a result of the decrease in the price of Bitcoin. Cryptocurrency trader @Cryptodonalt tweeted an XRP/BTC chart that shows the price trading between two important levels, a resistance and support at 5,200 and 2,000 satoshis, respectively.
Source: TwitterHe stated that the price is close to its bottom, and he is expecting a bounce:
I’m expecting a significant bounce somewhere in green. I’d argue XRP is probably a not so terrible buy already but given the fact that it’s hitting the lower boundary of the support outlined is very possible I’m playing defensive for now.
In this article, we will take a closer look at the XRP price in order to determine the likelihood of this bounce transpiring.
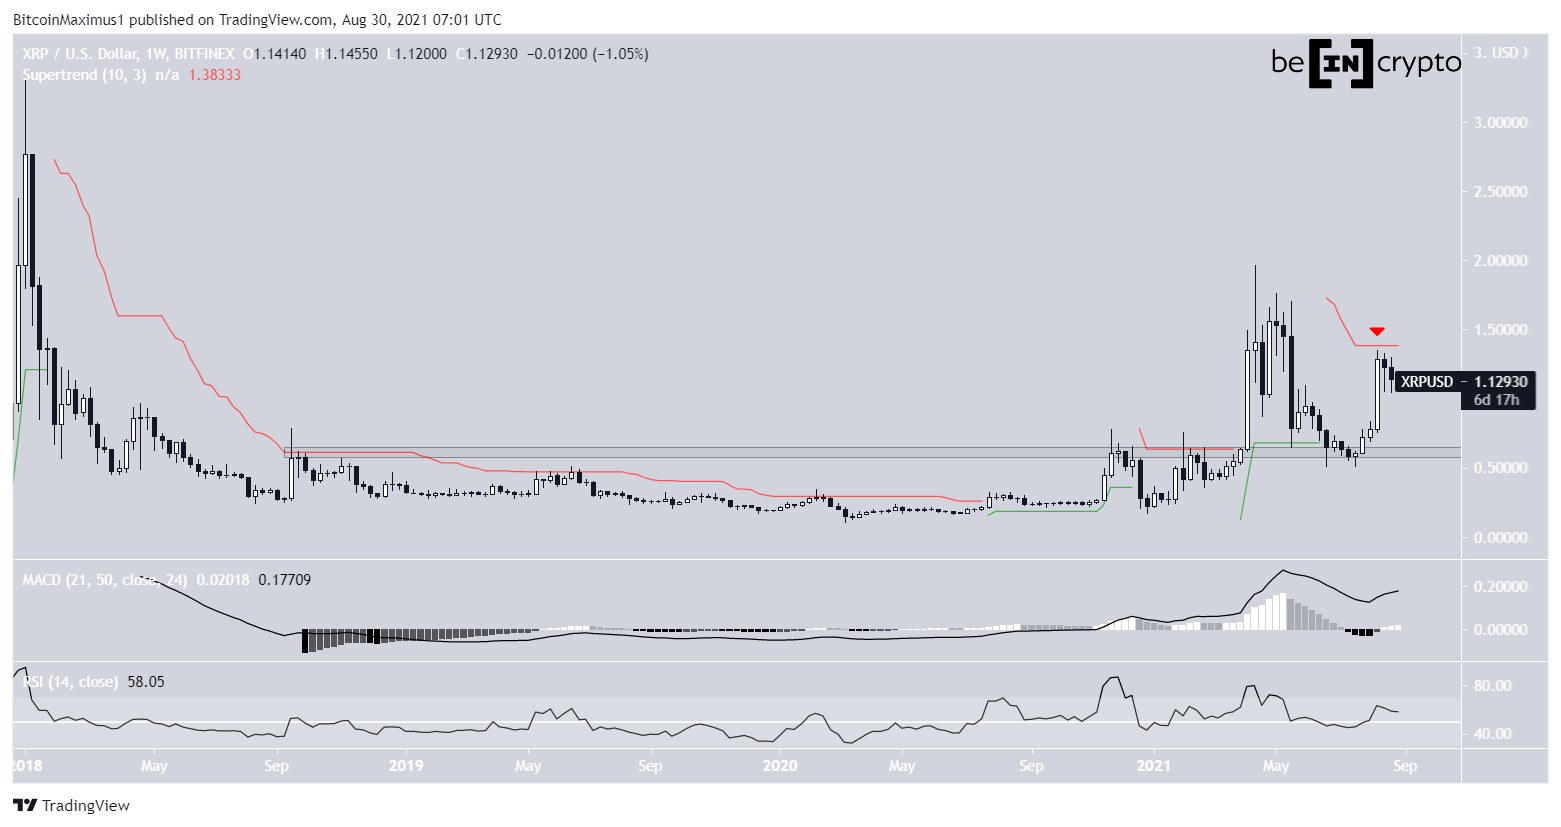
BreakdownThe XRP price had been trading above the 2,500 satoshi support area since July 2019. While the price bounced at this level, each bounce was weaker than the preceding one, creating a descending triangle in the process.
In the beginning of May, the price finally broke down from this pattern. This was expected, since the descending triangle is considered a bearish reversal pattern and the RSI had generated considerable hidden bearish divergence.
However, the closet support area seems to be at 1,500 satoshis instead of at 2,000 as stated in the tweet.
XRP Chart By Trading View Double BottomIn the short-term, it seems that the price could soon initiate an upward move. The price has created a short-term double bottom, which is also combined with bullish divergence in the RSI. This could initiate an upward move in order to validate the 2,500 satoshi level from which the price just broke down from.
Afterwards, XRP is expected to continue its descent towards the previously mentioned support level at 1,500 satoshis.
XRP Chart By Trading View
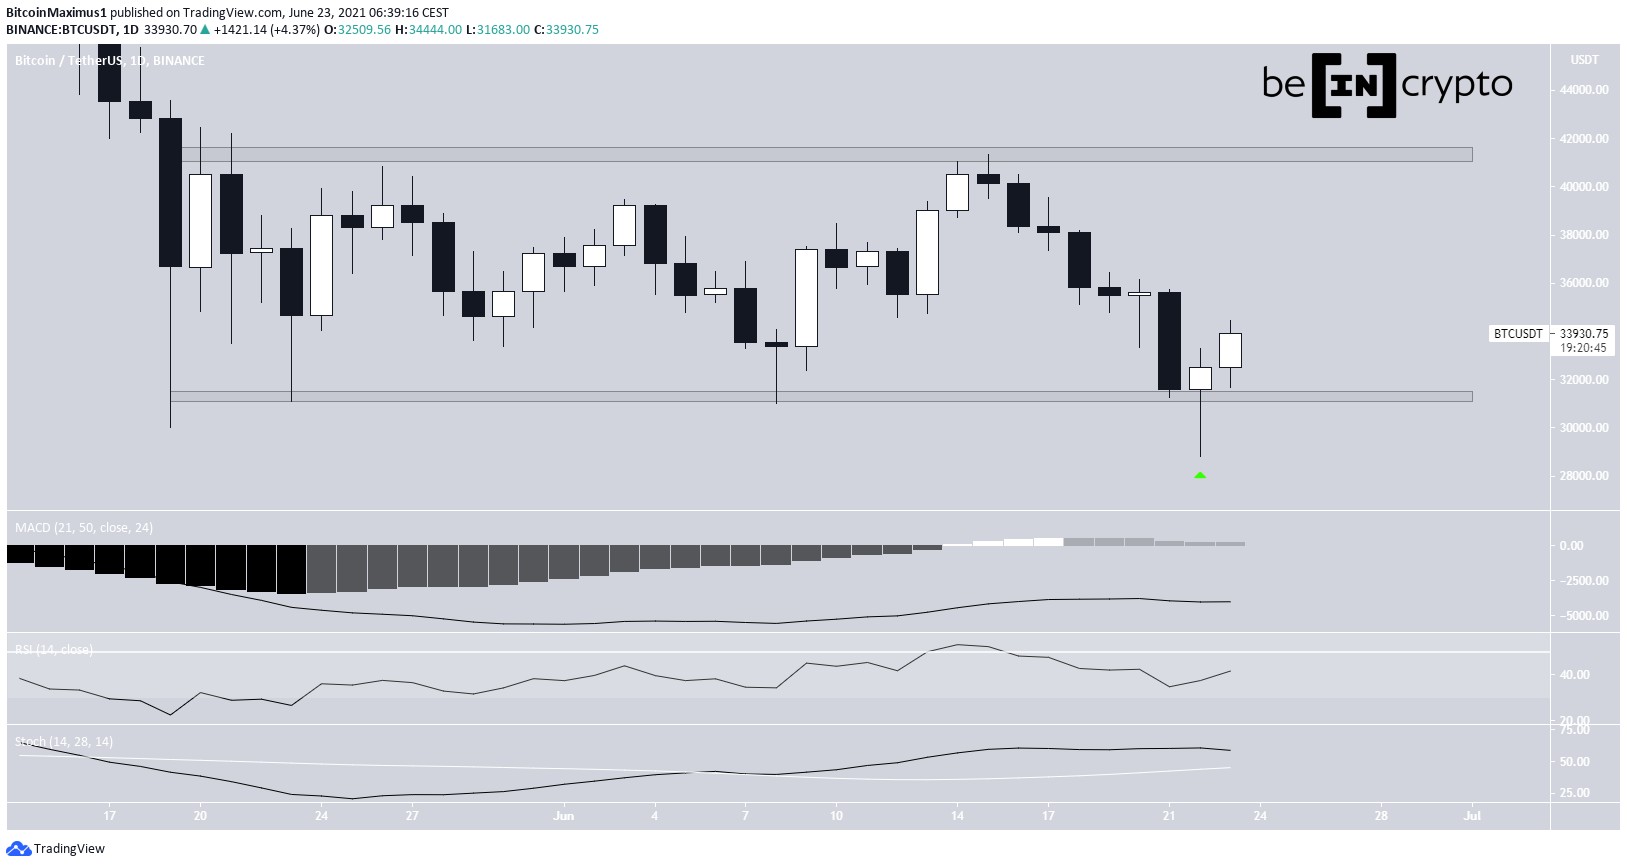
XRP/USDThe XRP/USD price has also broken down below an important support level, but this was an ascending support line instead of a descending triangle.
At the time of writing, the price was trading between support and resistance at $0.185 and $0.205, respectively. The price could touch the resistance area once more before falling to support. This would also fit with the possible movement outlined in the previous section.
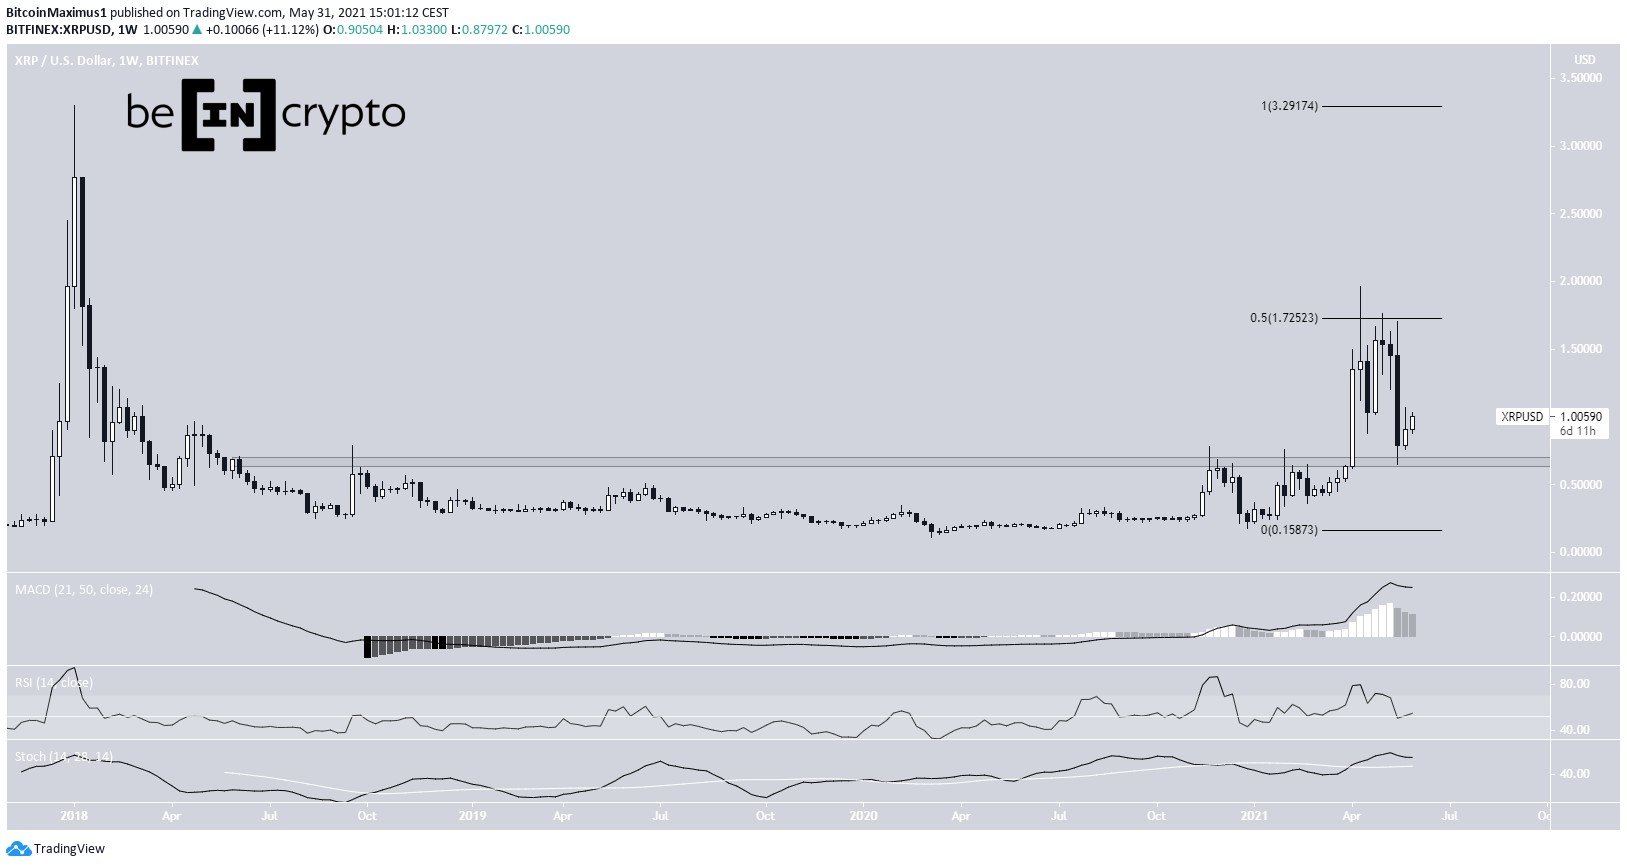
XRP Chart By Trading View ConclusionTo conclude, both the XRP/BTC and XRP/USD pairs have broken down from important support levels. While a short-term bounce could occur, both assets are expected to eventually continue their descent.
The post What Does XRP’s Breakdown Indicate for the Future Movement? appeared first on BeInCrypto.
origin »Bitcoin price in Telegram @btc_price_every_hour
Ripple (XRP) на Currencies.ru
|
|