2025-7-15 18:50 |
Ethereum painting rare price signal that might create foundation for longer-term rally origin »
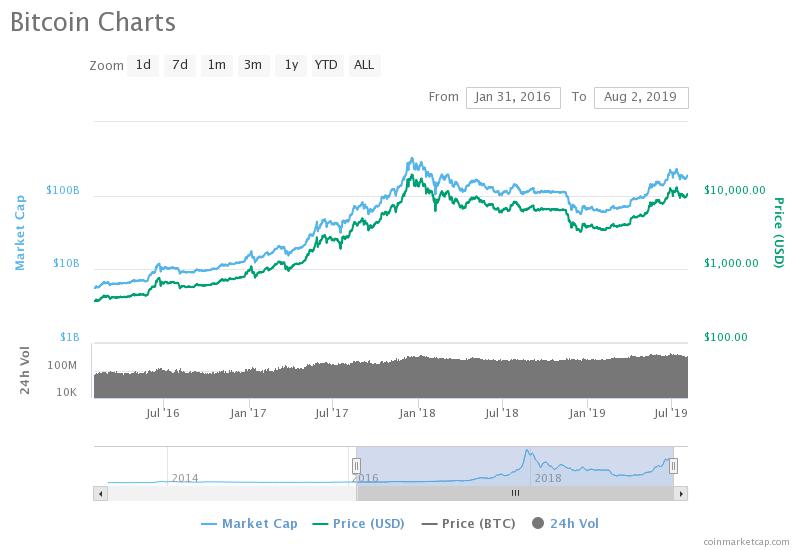
Bitcoin price in Telegram @btc_price_every_hour
ETH/LINK Price Action Candlestick Set (LINKETHPA) на Currencies.ru
$ 0 (+0.00% )
Объем 24H $0
Изменеия 24h: 0.00 % , 7d: -2.75 %
Cегодня L: $0 - H: $0
Капитализация $0 Rank 99999
Цена в час новости $ 467.1 (-100% )
|
|