This Indicator Shows Bitcoin May Surge Before Seeing a 20%+ Pullback

This Indicator Shows Bitcoin May Surge Before Seeing a 20%+ Pullback
фото показано с : newsbtc.com

2020-11-17 05:00

Bitcoin is seeing some intense strength today, with bulls pushing the cryptocurrency towards $17,000 following a brief bout of weakness earlier this week.

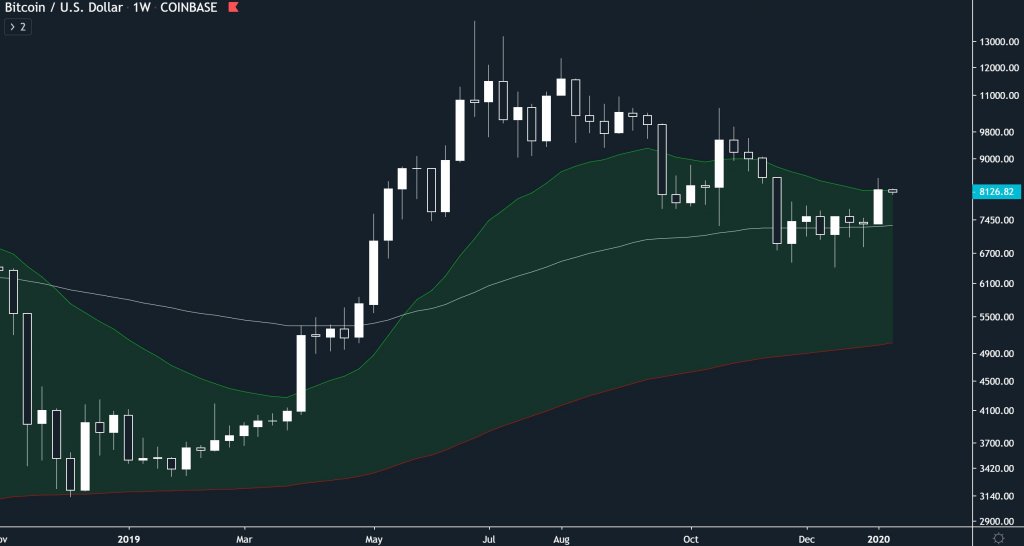
The ongoing uptrend has marked a significant extension of the trend seen throughout the past few months, with bears being unable to gain any ground against bulls as it continues pushing higher each week.

The crypto is now trading at the highest prices seen since its 2017 bull run, with it now just a hair away from setting fresh all-time highs.

This comes as retail mania remains tempered, with mainstream media attention and Google Trends activity both showing that the funds driving this trend are coming from non-retail sources.

One analyst is now pointing to the benchmark cryptocurrency’s RSI indicator for insights into where it may trend next.

He notes that although BTC’s uptrend shows some signs of being overheated at the moment, there’s still a strong possibility that it will see further upside before facing any selloff.

Typically, when the crypto’s RSI reaches the levels it’s at now, Bitcoin rallies for 3.5 days before seeing a 20%+ pullback.

Bitcoin Rallies Towards $17,000 as Uptrend Continues 

At the time of writing, Bitcoin is trading up just over 5% at its current price of $16,800. This marks a massive $1,000 rise from its 24-hour lows set a handful of hours ago.

Where the aggregated market trends in the near-term will likely depend mostly on whether or not BTC can surmount the resistance that exists around $17,000.

If this level is broken above, it may be clear skies up towards the key $20,000 level that investors are closely watching at the moment.

Analyst Claims Indicator Suggests BTC Could Rally Further Before Seeing a Pullback

While sharing his thoughts on where Bitcoin might trend in the near-term, one analyst explained that he is watching its RSI indicator for hints into where it may trend next.

He notes that BTC could rally for a few more days before facing a strong selloff.

“Sure, we’re running hot. That said, the last several times we were at these levels on the 3D RSI we continued higher, on average, for 3.5 more days before any significant pullback (>-20%).”

Image Courtesy of HornHairs. Source: BTCUSD on TradingView.

The coming few days should provide insight into just how far-reaching and sustainable this ongoing Bitcoin upswing will be.

Featured image from Unsplash. Charts from TradingView. origin »

Bitcoin price in Telegram @btc_price_every_hour

Bitcoin (BTC) на Currencies.ru

$ 58483.69 (-0.11%)
Объем 24H $32.513b
Изменеия 24h: -2.13 %, 7d: -7.06 %
Cегодня L: $58292 - H: $58632.51
Капитализация $1172.622b Rank 1
Цена в час новости $ 16658.61 (251.07%)

pushing bulls seeing bitcoin seen throughout past

pushing bulls → Результатов: 80


Фото:

This “Golden Pocket” Could Wipeout Ethereum’s Momentum

Ethereum is rapidly approaching its local highs as bulls begin garnering significant strength There is one “golden pocket” resistance level that could spark a major selloff if ETH is rejected here Some top traders are still noting that they expect this uptrend to extend significantly further The intense uptrend Ethereum incurred yesterday was able to further extend overnight, with the cryptocurrency pushing will into the mid-$180 region as its buyers make a bid at revisiting […]

2020-4-24 23:00


Фото:

Bitcoin blasts through key resistance as analysts eye potentially major upside

Bitcoin is currently in the process of breaking out of its recent consolidation phase, as BTC’s bulls are pushing the crypto up towards its key resistance levels around the $8,300 region. Although it does appear that the cryptocurrency is currently struggling to break above its recent highs of $8,500, its current momentum does appear to […] The post Bitcoin blasts through key resistance as analysts eye potentially major upside appeared first on CryptoSlate.

2020-1-14 08:30


Фото:

Bitcoin Price Analysis: Bulls Pushing BTC Towards $11,000

In my previous analysis, we looked at how bitcoin price action was trading in a key decision point. Now BTC bulls are heading back towards the $11,000 price mark forming a new uptrend. Bitcoin Price 1-Hour Chart On the 1 Hour chart for XBT/USD, we can see how the recent breakout of the asymmetrical triangle mentioned in a previous analysis has progressed over the last 3 days.

2019-8-3 19:16


Crypto Market Attempts Bullish Breakout, Gains $10 Billion In 3 Hours

It’s mid-week and the bulls have continued to show their strength. Since the bears descended on the market last week, they have wiped out more than $50 billion. One of the worst affected coins has been Ethereum but the crypto market has now gained over $10 billion in the last few hours, pushing its market […] The post Crypto Market Attempts Bullish Breakout, Gains $10 Billion In 3 Hours appeared first on ZyCrypto.

2019-7-18 22:37


Фото:

Bitcoin Price Analysis: Slow Upward Drift Tests Market Supply

A slow, grinding upward drift has been the name of the game for bitcoin’s market over the last few weeks. The upward drift is bringing us slowly to a level that was previously rejected violently:Figure 1: BTC-USD, Daily Candles, Upward DriftOur third rejection of the red resistance level shown above brought the market into a test of macro support in the mid-$3,000s.

2019-3-23 01:23