2019-5-2 12:30 |
Bitcoin [BTC], the largest cryptocurrency in the ecosystem, witnessed price correction after its minor hike, at press time. The coin had experienced a major price hike in early-April, pushing its valuation north of $5,000. The coin was priced at $5,350, at press time.
Litecoin [LTC] enjoyed a lucrative surge during the bull run, which saw its valuation pump tremendously. However, the coin devaluated by 1.08 percent, at press time. The coin recorded a market cap of $4.5 billion and the coin was valued at $76.86.
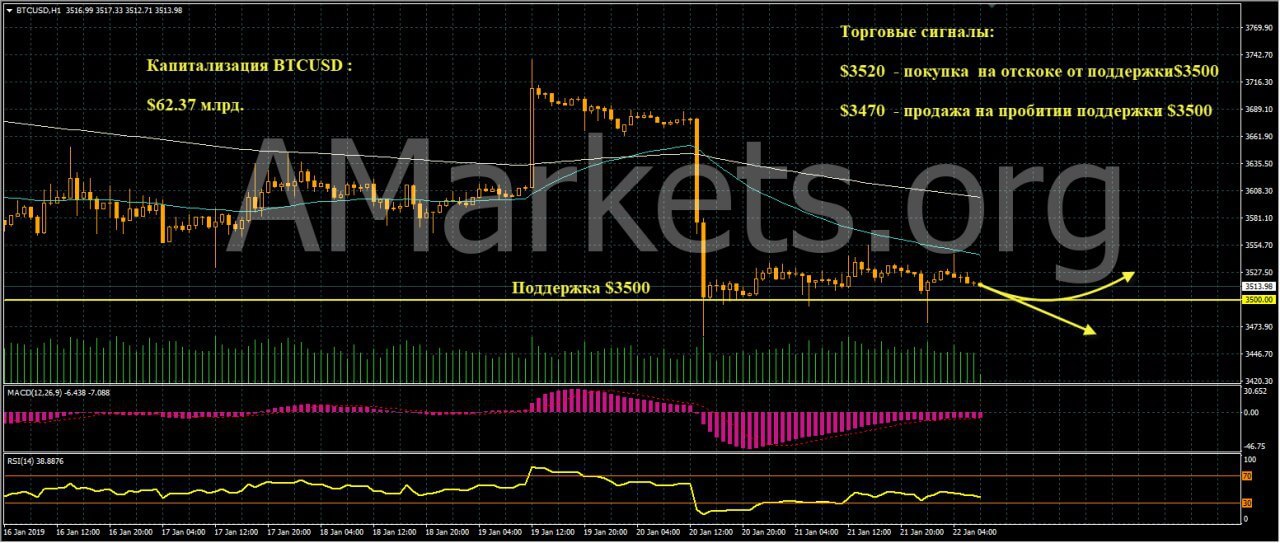
Bitcoin 1-day chart
Source: Trading View
The one-day chart for Bitcoin demonstrated a major uptrend which extended from $4123.97 to $5,290. The support line was at $3565.50. The resistance line formed after the surge was at $5552.40.
The Bollinger Bands indicated a volatile period for the coin’s valuation as the bands were diverging in the charts.
The MACD line remained below the red line, which implied a bearish trend.
The Chaikin Money Flow was above the zero-line on the chart, indicating incoming capital.
Litecoin 1-day chart
Source: Trading View
The one-day chart for Litecoin exhibited an uptrend and a downtrend in the chart. The support was at $41.50 and the resistance was at $93.14. The uptrend extended the valuation of the coin from $62.15 to $92.76, but the momentum failed to build up as the coin experienced devaluation from $92.50 to $78.48.
The Parabolic SAR’s dotted markers remained above the candlesticks, indicating a bearish trend for the coin.
The Awesome Oscillator indicated minor bullish momentum as green bars were seen in the charts.
The Fisher Transform pointed towards a bullish trend for the coin since the blue line remained over the red line.
Conclusion
The indicators suggested a stalemate between the bears and bulls for Bitcoin, whereas Litecoin leaned towards the bulls, at press time.
The post Bitcoin [BTC] and Litecoin [LTC] Price Analysis: LTC leans towards the bulls as stalemate takes over BTC market appeared first on AMBCrypto.
origin »Bitcoin price in Telegram @btc_price_every_hour
Bitcoin (BTC) на Currencies.ru
|
|