2022-7-11 14:30 |
Quant (QNT) is in the process of creating a bullish structure and its first higher low since June 13. Despite the ongoing breakout, the bullish structure is not yet confirmed.
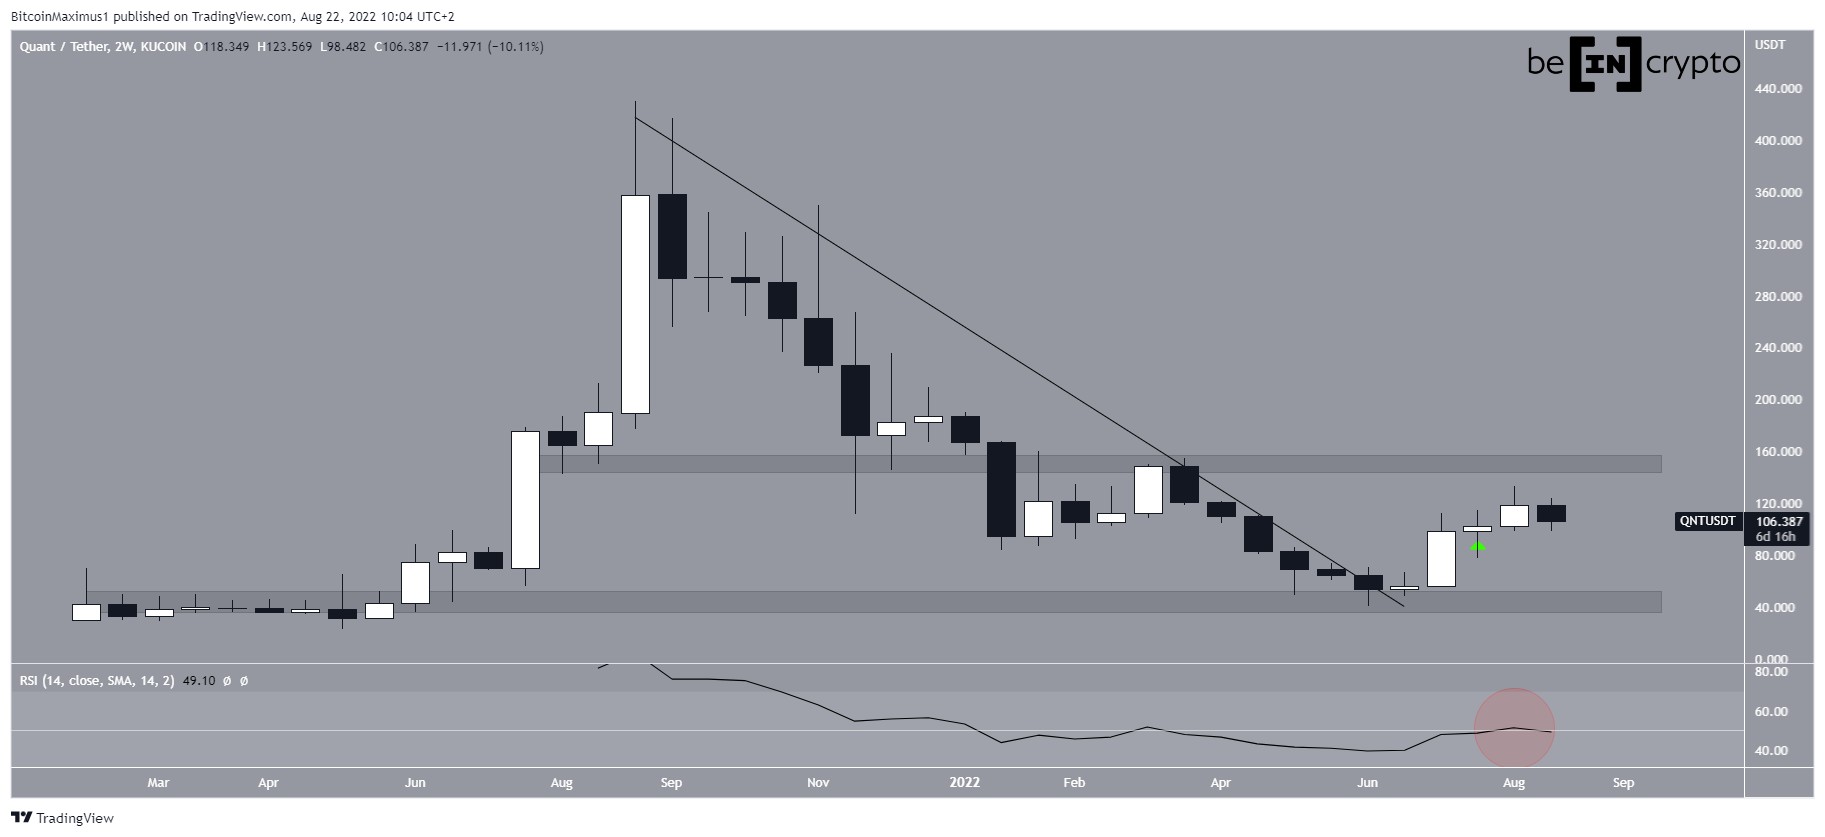
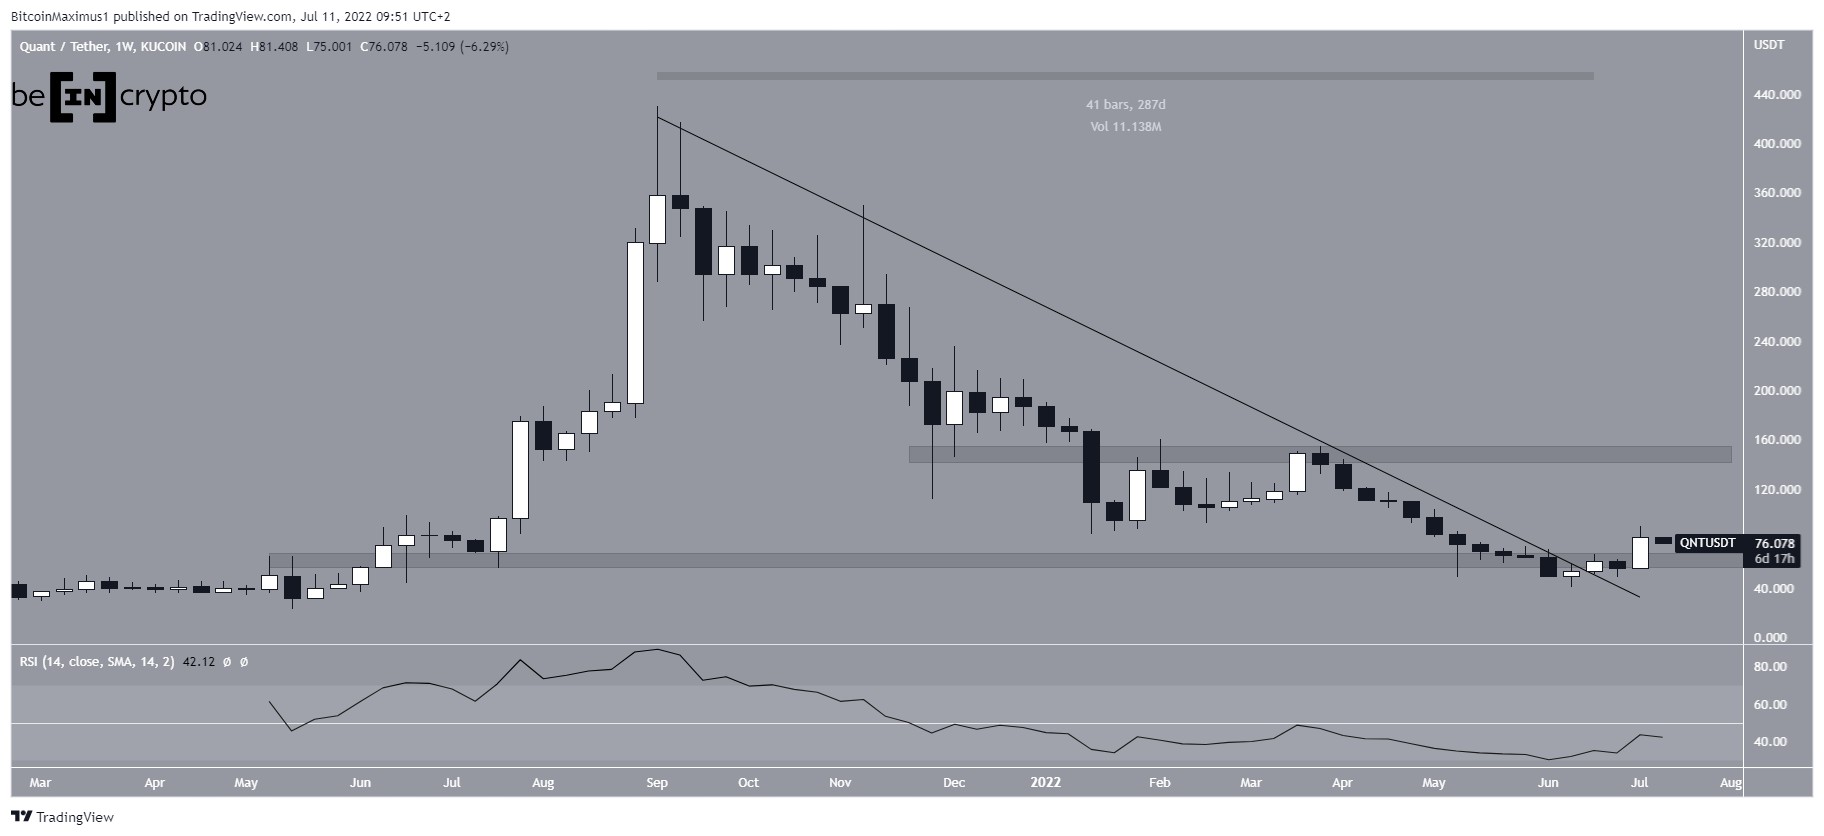
QNT has been decreasing underneath a descending line since Sept, when it reached an all-time high price of $420. So far, it reached a low of $40 last month.
The price bounced afterward and broke out from the descending resistance line. At the time of the breakout, the line had been in place for 287 days. Additionally, the price reclaimed the $60 horizontal area, validating it as support in the process. If the upward movement continues, the next closest resistance area would be at $45.
However, the weekly RSI is below 50 in what is considered a sign of a bearish trend.
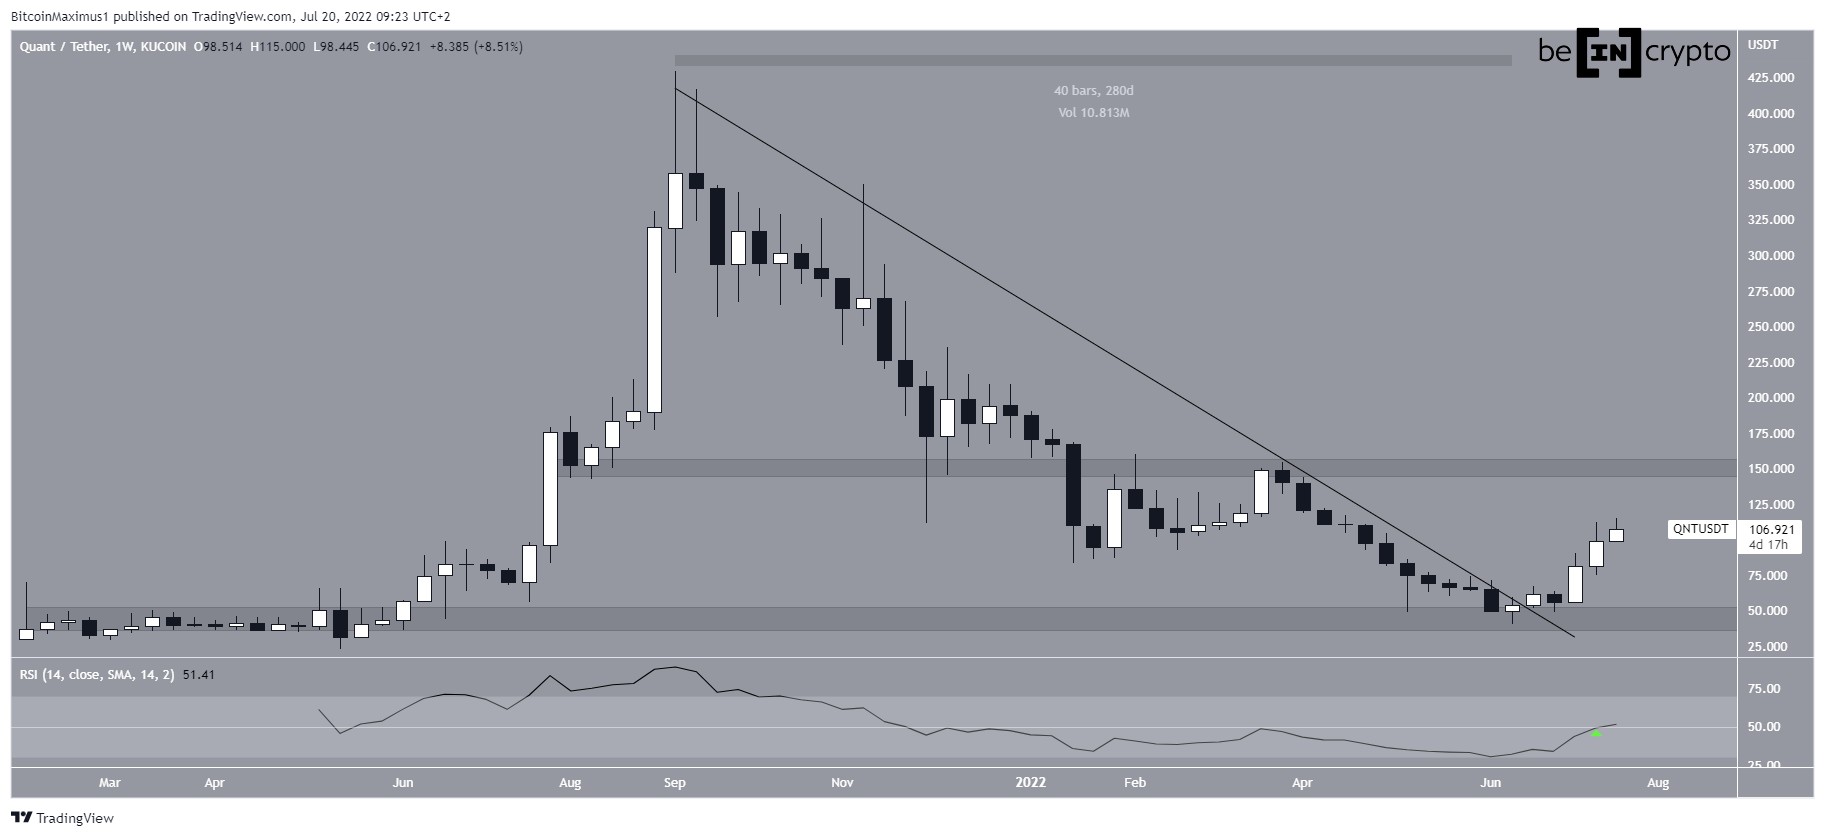
QNT/USDT Chart By TradingViewQNT enthusiast @Industry_q tweeted a weekly chart of QNT, stating that the next bull run will be glorious.
Source: TwitterWhile the price has broken out from the long-term descending resistance line, there are no clear signs for such a long-term bullish reversal.
QNT breaks outThe daily chart provides a more bullish outlook, since the price has already broken out from a descending resistance line that had previously been in place since March 28.
The breakout was preceded by a significant bullish divergence in the daily RSI (green line). The RSI has now moved above 50 in what is considered a sign of a bullish trend.
While the price was rejected by the 0.382 Fib retracement resistance level at $85, it is currently attempting to hold on above the $73 horizontal support area. Doing so would lead to a higher low and possibly the continuation of the upward movement.
QNT/USDT Chart By TradingView Future movementFinally, the six-hour chart shows that QNT has broken out from an ascending parallel channel. This is usually a sign that a new upward movement has begun.
However, the price is still attempting to validate the resistance line of the channel as support. If it is successful in doing so, the upward movement can continue.
If however the price fall below the wave one high (red line) at $65, it would seem that the entire upward movement is corrective and new lows will follow.
QNT/USDT Chart By TradingViewFor Be[in]Crypto’s latest bitcoin (BTC) analysis, click here.
The post Quant (QNT) Breaks out From 287-Day Resistance Line appeared first on BeInCrypto.
origin »Bitcoin price in Telegram @btc_price_every_hour
Quant (QNT) на Currencies.ru
|
|