Quant (QNT) Price Prediction: Bull Run Right Around the Corner?

2022-11-8 19:45

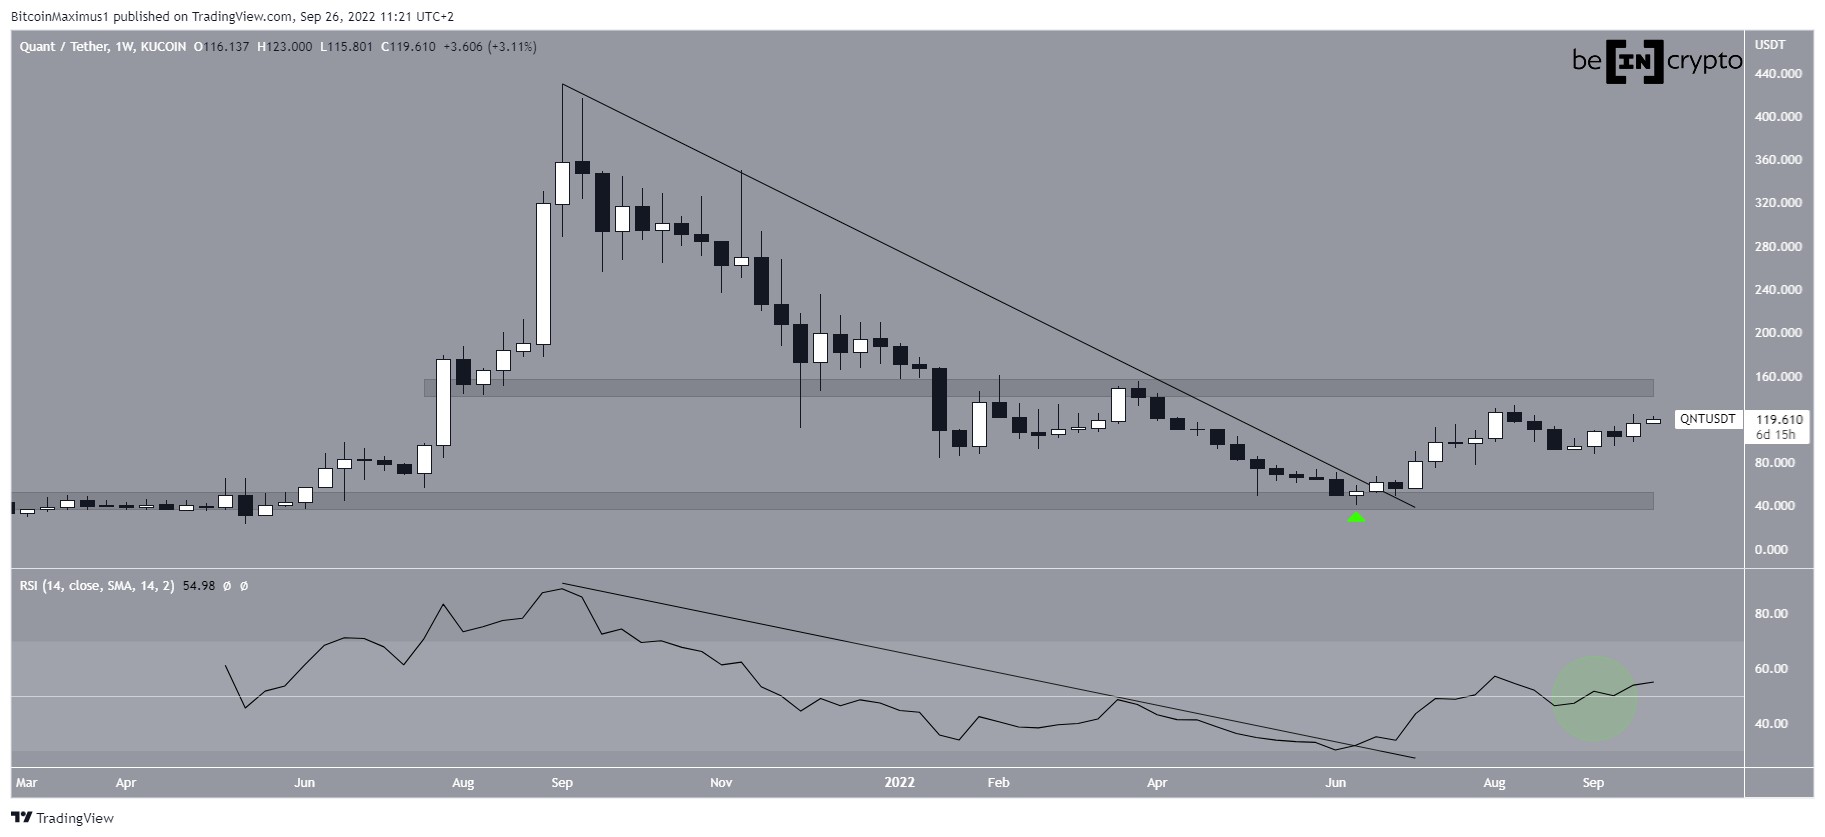
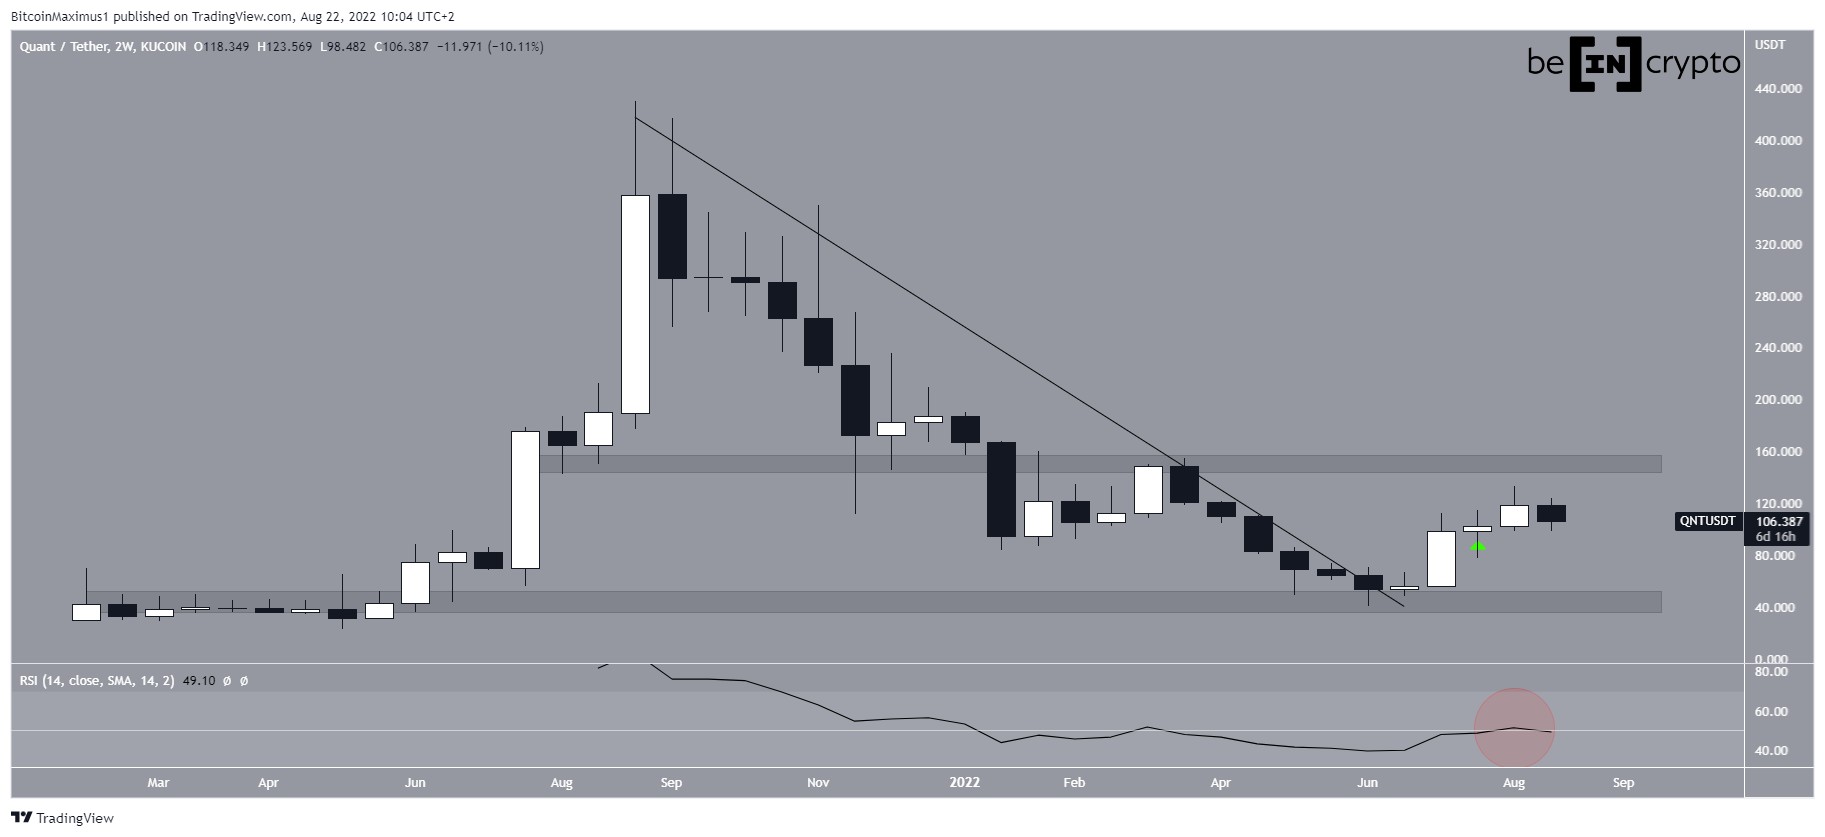
The Quant (QNT) price has possibly completed the correction that began on Oct. 17. If so, the next upward movement will take it towards $270.

The technical analysis from the daily time frame shows that the QNT price began an upward movement on June 13. The increased led to a high of $228 on Oct. 17.

While the price action is not following any patterns, QNT broke out from the $150 area on Oct. 13 (green icon). It is now in the process of validating it as support. The $150 area is also very close to the 0.382 Fib retracement support level.

Furthermore, the daily RSI has reached its long-term bullish divergence trend line (green line). As a result, the current level is ideal for the initiation of a bounce. Therefore, the daily time frame gives a bullish Quant price prediction.

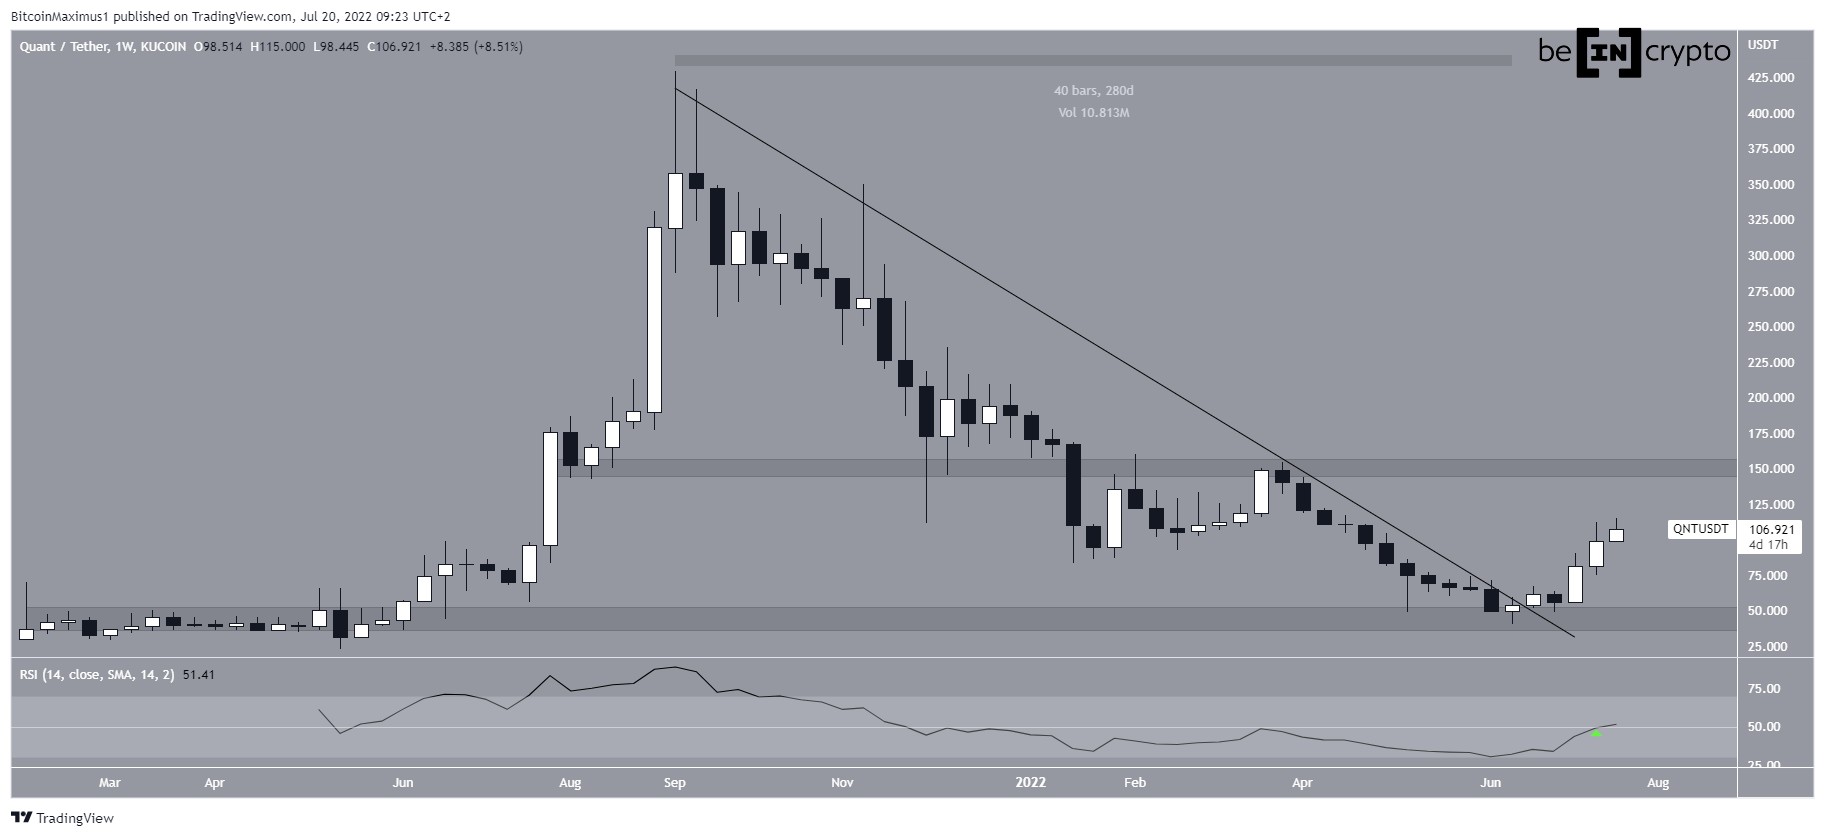
QNT/USDT Chart By TradingView QNT Price Prediction: Pullback is Complete

The wave count for QNT is bullish, supporting an upward movement towards $270. Currently, the QNT price is completing a fourth wave pullback.

The current level is ideal for the completion of the correction.

Firstly, the QNT price is right in the middle of the channel (red circle) connecting the high of waves one and two. Secondly, the $151.20 bottom was reached in exactly half the time (white lines) it took for wave three to complete.

As a result, it is possible that the Quant price will now begin wave five. The most likely target for the future price is between $269-$275. The target is found using the 0.618 length of waves one and three (red) and the 1.61 external Fib retracement of wave four (black).

A decrease below the wave one high of $133 (red line) would invalidate this particular wave count and bullish Quant price prediction.

QNT/USDT Chart By TradingView

For BeInCrypto’s latest Bitcoin (BTC) analysis, click here.

Disclaimer: BeInCrypto strives to provide accurate and up-to-date information, but it will not be responsible for any missing facts or inaccurate information. You comply and understand that you should use any of this information at your own risk. Cryptocurrencies are highly volatile financial assets, so research and make your own financial decisions.

The post Quant (QNT) Price Prediction: Bull Run Right Around the Corner? appeared first on BeInCrypto.

Similar to Notcoin - TapSwap on Solana Airdrops In 2024

origin »

Quant (QNT) на Currencies.ru

$ 0 (+0.00%)
Объем 24H $0
Изменеия 24h: 0.00 %, 7d: 0.00 %
Cегодня L: $0 - H: $104.44
Капитализация $0 Rank 99999
Цена в час новости $ 152.15 (-100%)

quant price qnt corner around prediction run

quant price → Результатов: 52


Quant Balloons Over 35% In Last 7 Days Courtesy Of Strong Social Metrics

Quant is showing a strong push in the face of struggles in the crypto space as it doubled (and added some more) its 14-day price pump. Quant outperforms Bitcoin and Ethereum in terms of 14-day and 30-day price increases QNT is down by almost 10% over the last 24-hours but is still up by almost 29% over the last week Quant could rally all the way up to $300 While a price increase of 28.

2022-10-19 12:57


Quant Explains How Bitcoin Funding Rate Predicted The Latest Top

A quant has explained how the Bitcoin funding rate (72 hour) may be able to correctly signal tops and bottoms in the price of the crypto. Bitcoin Funding Rate May Be Able To Indicate Tops And Bottoms In The Market As explained by an analyst in a CryptoQuant post, the 72-hour version of the funding rate looks to have been effective at pointing out tops and bottoms in the BTC market.

2022-4-8 22:00


Фото:

Quant Analyst PlanB Reveals Why He Is Still Sticking With The S2F Model Despite Bitcoin Failing To Hit $100k This Year

PlanB, the pseudonymous creator of the Bitcoin stock-to-flow (S2F) model has been getting a lot of pushbacks from market participants who are considering the model to have failed as the price of Bitcoin seems to have failed to reach the projected price of $100,000 by end of the year. What critics have said about the […]

2021-12-27 21:22


Quant Explains How Bitcoin On-Chain Data Can Identify Peaks Vs Shakeouts

A quant explains how Bitcoin on-chain data may be used to identify whether a high was because of peak formation or due to a shakeout. Open Interest, Funding Rates, And LTH-SOPR May Signal Whether A Peak Vs A Shakeout As explained by an analyst in a CryptoQuant post, a combination of different on-chain indicators may be able to identify whether a high means the price is forming a peak or if it’s just a shakeout.

2021-11-5 22:00


Фото:

Is Bitcoin’s Parabolic Bull Market Over? Quant Analyst PlanB Says No

Bitcoin has been on a steady incline for a couple of months now. The bulls, however, seem to be taking a breather after the cryptocurrency attained $61,000 all-time highs earlier this month. Nonetheless, a pseudonymous Dutch crypto researcher behind the popularized Stock-to-Flow (S2F) price model, PlanB, suggests that the price may continue upwards on a […]

2021-3-29 21:24


Фото:

Ethereum’s Vitalik Buterin Lambastes The Stock-to-Flow Model That Predicts 6 Figures For BTC Price

The co-founder of the world’s second-largest blockchain Ethereum, Vitalik Buterin, strongly disapproves of the Stock-to-Flow (S2F) model that has drawn a lot of attention in the crypto space.  The S2F model was created by anonymous quant analyst PlanB, and it takes into account bitcoin’s scarcity after halving events to predict the asset’s price. The model […]

2020-6-16 18:38