Price Analysis: BTC flashes sell signal as bulls seek $30K

Price Analysis: BTC flashes sell signal as bulls seek $30K
фото показано с : coinjournal.net

2021-1-1 14:40

Bitcoin (BTC) reached a new all-time high around $29,321 but could fall sharply in a blow-off top pattern

BTC/USD remains in an uptrend and might hit a new all-time (ATH) high above $30,000 by New Year’s Day. The bullish outlook follows Bitcoin recording prices above $29,000 for the very first time.

At the time of writing, Bitcoin is trading around $29,053, off intraday highs of $29,321 on the major US cryptocurrency exchange Coinbase. If bulls print another $1,000 candle today, BTC/USD could crack the psychological level at $30,000. In price discovery mode, there would be no telling where the next stop would be.

Bitcoin blow-off top next?

Every address that ever bought Bitcoin before it broke its 2017 ATH is in profit, with institutions that bought in the current bull market also realising massive gains already. But given the parabolic price action witnessed over the past few weeks, it’s likely a cool-off morphing into an extended sideways period or we might even see a blow-off top pattern.

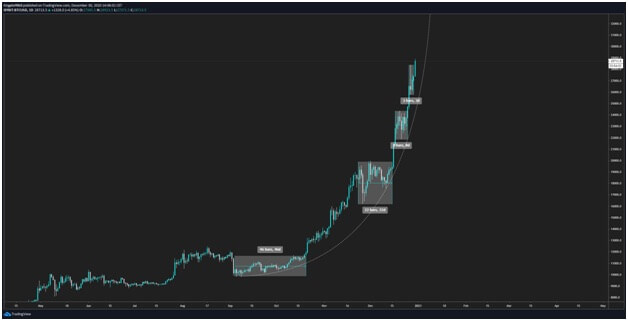
According to one pseudonymous trader identifying on Twitter as Mr. Chief, Bitcoin’s price chart suggests the latter is likely.

The trader recently noted this as BTC/USD jumped above $29K.

“Notice the duration of each consolidation phase is shorter and shorter. We’re getting close to a blow-off top IMO.”

Chart showing BTC price and the shrinking periods for consolidation. Source: Mr. Chief on Twitter

The pessimistic scenario above is likely given the technical picture on the 4-hour time frame.

The BTC/USD pair on the chart below shows that the price remains within a bullish channel. Also importantly, the trendline that presented as a previous resistance line now acts as the immediate support level.

However, the TD sequential has presented a sell signal in the form of a green nine candle, while the RSI is also suggesting divergence. If the price bounces off current levels or the $30,000 psychological barrier, the downside might be steep.

BTC/USD 4-hour chart. Source: TradingView

In this case, buyers can look to defend gains at the previous resistance line and the lower boundary of the upside parallel channel. The two levels offer initial support near $27,000.

If the sell-off pressure mounts further, the next support zone is near the 50-SMA ($25,815 on the 4-hour chart).

BTC/USD hourly chart. Source: TradingView

On the 1-hour chart, BTC/USD has crossed beneath a major support level presented by a rising trendline. The hourly RSI also suggests a negative divergence as it shifts from overbought territory. Short term, bulls need to push prices above the trendline, which will strengthen the overall bullish picture.

On the contrary, the SMA-50 ($27,884) and SMA-100 ($27,420) provide initial support levels.

The post Price Analysis: BTC flashes sell signal as bulls seek $30K appeared first on Coin Journal.

origin »

Bitcoin price in Telegram @btc_price_every_hour

Bitcoin (BTC) на Currencies.ru

$ 71638.57 (+0.04%)
Объем 24H $48.301b
Изменеия 24h: 4.42 %, 7d: 4.48 %
Cегодня L: $69275.57 - H: $72014.77
Капитализация $1433.695b Rank 1
Цена в час новости $ 29027.83 (146.79%)

btc bulls seek price 30k analysis signal

btc bulls → Результатов: 126


Биткоину грозит откат до $10 000

Крупнейшая цифровая валюта находилась под сильным давлением на протяжении последних нескольких дней подряд. Многие аналитики ожидают не только сохранения прессинга, но и его усиления, так как активность покупателей в криптосфере продолжает ослабевать.

2019-8-12 19:12


Ren Price Analysis REN / BTC: Potential Rise

Ren has a bullish short-term bias against Bitcoin, with the cryptocurrency trading well above its 200-period moving average on the four-hour time frame The four-hour time frame shows that bulls are working hard to invalidate a bearish head and shoulders pattern The daily time frame continues to show that a major technical breakout is underway […] The post Ren Price Analysis REN / BTC: Potential Rise appeared first on Crypto Briefing.

2019-8-5 18:20


Фото:

Bitcoin Price Analysis: Bulls Pushing BTC Towards $11,000

In my previous analysis, we looked at how bitcoin price action was trading in a key decision point. Now BTC bulls are heading back towards the $11,000 price mark forming a new uptrend. Bitcoin Price 1-Hour Chart On the 1 Hour chart for XBT/USD, we can see how the recent breakout of the asymmetrical triangle mentioned in a previous analysis has progressed over the last 3 days.

2019-8-3 19:16


GXChain Price Analysis GXC / BTC: Baiting The Bulls

GXChain has a bullish short-term bias against Bitcoin, with the GXC / BTC pair breaking above key resistance The four-hour time frame is showing that a bullish inverted head and shoulders pattern is forming A bearish head and shoulders pattern continues to take shape on the daily time frame Fundamental Analysis GXChain has gained bullish […] The post GXChain Price Analysis GXC / BTC: Baiting The Bulls appeared first on Crypto Briefing.

2019-8-1 16:10


Bitcoin Weekly Close Nears as Bears Maintain Control; Will BTC Soon Drop Below $9,000?

Bitcoin (BTC) and the aggregated crypto markets have climbed slightly today after facing significant downwards pressure over the past couple of days. This recent price action has signaled that bears are currently in full control of the cryptocurrency, and without a major push by bulls, Bitcoin could face an incredibly weak weekly close that spells.

2019-7-29 00:30


Фото:

Was BitMEX ‘Again’ Behind The Latest Bitcoin Flash Crash?

BitMEX, the most liquid exchange on the market is being accused of market manipulation (again). Was Arthur Hayes’s exchange the orchestrator of the latest flash crash? Market Manipulation Behind the Latest Spiral It’s been a harrowing week for Bitcoin bulls as the markets peaked at over $13000 last Wednesday and have stepped down a little further almost each day since.

2019-7-19 21:00