2020-9-24 18:36 |
The IOTA (IOTA) price is approaching an important support area that is expected to provide a relief rally in response to the ongoing decrease since Aug. 21.
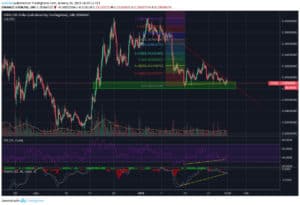
Retracement To SupportThe IOTA price has been decreasing since a high of $0.451 on Aug. 21. The decrease has been sharp, but the price is approaching an important support level found at $0.21, which could initiate a bounce and halt the current decrease.
Besides being a minor support area, the area also represents the 0.618 Fib level of the entire upward move beginning on March 13.
IOTA Chart By TradingView
Technical indicators do not yet suggest an impending reversal. While the MACD is increasing, it has not yet crossed into positive territory. Furthermore, both the RSI and Stochastic Oscillator are nearing their oversold levels, but have not generated any bullish divergence/bullish cross.
A breakout above the descending resistance line in place since Aug. 21 would likely cause indicators to turn bullish and suggest that the correction has ended.
IOTA Chart By TradingView
Current MovementCryptocurrency trader @Mesawine1 outlined an IOTA chart which shows the price resting at an important area at $0.27. He believes that a break in either side will determine the direction of the next movement.
Source: Twitter
Since the tweet, the price has broken down from the area and is approaching the next support at $0.21.
However, short-term indicators are turning bullish. After generating bullish divergence, the price began to increase, causing the MACD to turn positive. In addition, the trendline of the bullish divergence is still intact.
It seems likely that the price will reach the descending resistance line and minor resistance area at $0.258, but we cannot yet determine if it breaks out.
IOTA Chart By TradingView
IOTA/BTCThe IOTA/BTC chart is similar to its USD counterpart, with the only difference being that the price has already reached its main support area at 2,200 satoshis.
Once it did, the price began an upward move that is still ongoing.
However, technical indicators are still bearish, and a rejection is expected once the price reaches the minor 2,600 satoshi resistance area.
IOTA Chart By TradingView
The post IOTA’s Decrease Could Soon Come To An End appeared first on BeInCrypto.
origin »IOTA (IOTA) на Currencies.ru
|
|


