2022-5-4 02:00 |
IOTA has broken down from a horizontal support area that had previously been in place for more than 300 days. There are no bullish reversal signs in the long- or the medium-term.
IOTA has been decreasing underneath a descending resistance line since reaching a high of $2.74 on April 16, 2021. Initially, the price bounced five times (green icons) at the $0.75 horizontal support area.
Still, it failed to initiate an upward movement and finally broke down on April 11, 2022. So far, it reached a low of $0.49 on May 2.
Technical indicators in the weekly time frame are bearish. The reason for this is that both the RSI and MACD are falling, the former is below 50 and the latter is negative.
As a result of both the price action and indicator readings, the most likely scenario would be a continued descent towards the $0.42 horizontal support area.
Chart By TradingViewCryptocurrency trader @CryptoJobs3 tweeted a chart of IOTA which shows the price returning to a long-term support level just above $0.40. The level coincides with that outlined in the image above.
Source: Twitter New yearly lowsThe daily chart shows that since Jan. 22, IOTA has been decreasing alongside a descending support line. While the line has been validated four times, its slope is not certain due to the presence of several long lower wicks. While following the line, IOTA reached a new yearly low of $0.499 on May 1.
Technical indicators in the daily time frame are bearish. Similar to the weekly time frame, the RSI and MACD are both falling, the former is below 50 and the latter is negative. Additionally, while the MACD had initially generated some bullish divergence (green line), its trendline is now broken.
Therefore, the daily time frame readings are in alignment with those from the weekly time frame, suggesting that new lows are on the horizon.
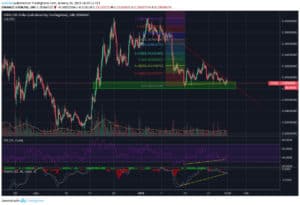
Chart By TradingView Short-term IOTA movementFinally, the two-hour chart shows that IOTA has bounced thrice at the $0.515 horizontal support area. This effectively created a triple bottom, which is considered a bullish pattern.
Additionally, the pattern has been combined with a bullish divergence in the RSI, whose trendline is still intact.
In order for the pattern to be confirmed, IOTA has to break out from the $0.55 area.
However, due to the bearish longer-term readings, this would likely only be a bounce prior to another descent.
Chart By TradingViewFor BeInCrypto’s previous Bitcoin (BTC) analysis, click here
The post IOTA Drops to New Yearly Low as $0.42 Becomes Crucial Support Level appeared first on BeInCrypto.
origin »Bitcoin price in Telegram @btc_price_every_hour
IOTA (IOTA) на Currencies.ru
|
|