Новости о Pattern Daily [ Фото новости ] [ Свежие новости ] | |

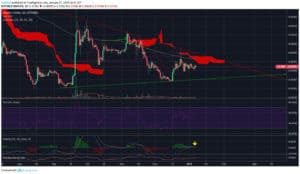
Tron (TRX) Daily Price Forecast – January 14
TRX/USD Medium-term Trend: Bullish Supply zones: $0. 04000, $0. 05000, $0. 06000 Demand zones: $0. 01000, $0. 00900, $0. 00800 TRX returns to a bullish trend in its medium-term outlook. An inverted head and shoulder pattern is the cryptocurrency structure in the medium-term. дальше »
2019-1-14 17:05 | |
|
|
Price Analysis: Bitcoin, Ethereum, XRP, Stellar, Litecoin, Cardano, EOS, IOTA, Tron, and Dogecoin
Bitcoin [BTC] Price Analysis: A look at the Daily chart for Bitcoin shows that price is currently trading at the $4100 level. Price is trying to make a reverse head and shoulders pattern with a neckline at $4440, coinciding with the 0. дальше »
2019-1-8 21:39 | |
|
|

Bitcoin Price Analysis: Range-Bound Market Coiled for Next Move
For the better part of a month and a half, bitcoin has been fairly range-bound and unable to establish new lows or new highs. There are some bullish and bearish setups on the horizon for bitcoin, so let’s check out both sides of the argument because currently the market is sitting in the middle of Indecisionville — the most immediate sign of which is this glaringly obvious head-and-shoulders bottom reversal pattern:Figure 1: BTC-USD, Daily Candles, Head-and-Shoulders BottomThis current pattern is nothing more than a setup at the moment, but it represents one potential outcome of this sustained consolidation. дальше »
2019-1-4 02:22 | |
|
|
Does an Ascending Triangle for Bitcoin [BTC] Mean Price is Finished Bottoming Out?
Cryptocurrencies have had a bullish start to 2019 after an extremely bearish finish to 2019. The market leader is Bitcoin is forming an ascending triangle pattern on the daily. An ascending triangle is a bullish continuation pattern which is formed by both an upward trend line and a point of resistance. дальше »
2019-1-3 17:47 | |
|
|

Bitcoin Price Analysis: Strong Rally Tests Overhanging Resistance
Earlier this week, bitcoin enjoyed a strong and quick rally, spanning all the way from the low $3,100s to the upper $3,900s — in other words, a move that previously took the market weeks to make, this time took place in just a few short days. дальше »
2018-12-20 02:21 | |
|
|
Bitcoin Price Analysis: Bear Pennant Breakout Puts $1,700 Price in Sight
Another week, another low. Bitcoin’s market has been bleeding relentlessly for weeks and now, after falling 50% in value in just one month, the market has managed to break south of a major bearish consolidation pattern called a bear pennant:Figure 1: BTC-USD, 4-Hour Candles, Bear Pennant BreakoutThis is a massive bear pennant with a staggering $2,000 measured move. дальше »
2018-12-12 01:52 | |
|
|
STELLAR (XLM) Daily Price Forecast – December 11
XLM/USD Medium-term Trend: Bearish Supply zone: $0. 2000, $0. 2500, $0. 3000 Demand zone: $0. 0800, $0. 0600, $0. 0400 XLM continues in a bearish trend as it breaks down from the bearish pennant pattern in its medium-term outlook. дальше »
2018-12-11 07:55 | |
|
|
Bitcoin (BTC) Price Analysis: Wedge Support Test
Bitcoin broke below a short-term consolidation pattern and is making its way down to test the bottom of the falling wedge on its daily time frame. Another break lower could expose this cryptocurrency to a steep free fall. дальше »
2018-11-23 04:32 | |
|
|
Litecoin (LTC) Daily Price Forecast – November 22
LTC/USD Medium-term Trend: Ranging Resistance Levels: $66, $68, $70 Support Levels: $30, $28, $26 Yesterday, November 21, the price of Litecoin was in a sideways trend. The digital currency fell to the low of $33. дальше »
2018-11-22 09:25 | |
|
|
Litecoin (LTC) Daily Price Forecast – November 21
LTC/USD Medium-term Trend: Bearish Resistance Levels: $66, $68, $70 Support Levels: $30, $28, $26 Yesterday, November 20, the price of Litecoin was in a bearish trend. The crypto's price no longer follow the bearish pattern of lower lows and lower highs. дальше »
2018-11-21 09:49 | |
|
|
Bitcoin Price Analysis: Yearly Support Breaks as Bitcoin Tests Underlying Demand
After months and months of consolidation, the yearly support finally broke and now bitcoin has found itself in the lower $5000s for the first time since 2017:Figure 1: BTC-USD, Daily Candles, Broken SupportBitcoin managed to drop a staggering 16% yesterday as the market sliced through the long held support like a knife through butter. дальше »
2018-11-16 01:28 | |
|
|
Bitcoin Cash (BCH) Daily Price Forecast – November 1
BCH/USD Medium-term Trend: Bearish Supply zones: $600, $700, $800 Demand zones: $300, $200, $100 BCH is back in a bearish trend in its medium-term outlook. After a remarkable move to the upside as predicted yesterday the cryptocurrency resume the journey south. дальше »
2018-11-1 08:38 | |
|
|

Prominent Analyst: Bitcoin is Still in the Middle of a Bear Market
An inverse monetary velocity pattern indicates that bitcoin bulls are wrong about the market’s next bull run. Willi Woo, a prominent cryptocurrency market analyst, pitted the digital currency network value (or market cap) against the daily US Dollar volume transmitted through the blockchain. дальше »
2018-10-27 14:34 | |
|
|
Bitcoin Price Analysis: Bitcoin Consolidation Forecasts $3,500 Move
A strong round of buys hit the market this weekend as unsubstantiated rumors began to circle surrounding Tether and Bitfinex’s potential insolvency. I won’t be going into the details surrounding the allegations because, like I said, they are nothing more than unsubstantiated rumors. дальше »
2018-10-17 01:03 | |
|
|
Bitcoin (BTC) Price Analysis: Still Buying on Dips?
Bitcoin has formed lower highs and higher lows on its daily time frame to create a symmetrical triangle consolidation pattern. Price has dropped back down to support, which appears to be defended by bulls buying on dips. дальше »
2018-10-15 07:05 | |
|
|
Bitcoin (BTC): A Method To The Madness
Bitcoin (BTC) does not just go up and down, breaks supports and resistances based on sudden whims. Most traders are so focused on the 15 min chart that they miss the big picture. They fail to realize that major trading on exchanges is done by algorithmic bots. дальше »
2018-10-15 21:30 | |
|
|
Ethereum Classic (ETC) Can Easily End The Year Above $100
Ethereum Classic (ETC) is highly likely to trade north of $100 by end of the year. This does not require a very bullish Bitcoin (BTC). In fact, if Bitcoin (BTC) trades around $10,000, that would do the job for Ethereum Classic (ETC). дальше »
2018-10-12 17:30 | |
|
|
Ethereum (ETH) Price Watch: Next Downside Targets
Ethereum Price Key Highlights Ethereum broke below its latest consolidation pattern, indicating that losses are in the cards. Price is still trading inside a descending channel on the daily chart and looks ready for a test of support. дальше »
2018-10-12 06:47 | |
|
|
Are Bitcoin Whales The Ones Shaping The Market?
A popular school of thought among many people in the crypto space is that a small number of Bitcoin owners with a big enough load of bitcoin to move the market are behind the unstable markets and the price manipulation. дальше »
2018-10-11 16:30 | |
|
|
Eos (EOS) Investors Unmoved By Bitcoin (BTC) Selloff
Chart for EOS/USD (1W) Cryptocurrency markets plunge deep in the red, dancing to the tune of Bitcoin (BTC). Eos (EOS) investors are not moved by this confusion. In fact, as the above weekly chart for EOS/USD shows, the price of Eos (EOS) has not corrected the same way as the rest of the market. дальше »
2018-10-11 00:30 | |
|
|
Ethereum (ETH) Daily Price Forecast – October 8
ETH/USD Medium-term Trend: Bullish Resistance Levels: $260, $280, $300 Support Levels: $200, $180, $160 Last week the price of Ethereum was in a sideways trend. There has been no significant price movement as the digital currency moves in a horizontal pattern. дальше »
2018-10-8 15:59 | |
|
|
Ethereum (ETH): Final Shakeout Or Another Bear Trend?
Ethereum (ETH) seems to have just broken its symmetrical triangle to the downside. This was expected as the price entered the triangle from the upside. Symmetrical triangle being a continuation pattern had a higher chance of breaking to the downside. дальше »
2018-10-7 18:00 | |
|
|
Tron (TRX) Price Analysis: Trends of October 2–8, 2018
There is a probability for the uptrend movement this week in case the price breakout to the north from the ascending triangle pattern formed on both daily and 4-Hour charts. The post Tron (TRX) Price Analysis: Trends of October 2–8, 2018 appeared first on CoinSpeaker. дальше »
2018-10-3 11:30 | |
|
|
EOS/USD Price Analysis: Trends of October 1–7, 2018
The price has formed an “ascending triangle” pattern on the daily and 4-hour chart which suggests the probability for the price increase toward a resistance level of $6.8. The post EOS/USD Price Analysis: Trends of October 1–7, 2018 appeared first on CoinSpeaker. дальше »
2018-10-2 00:15 | |
|
|
Bitcoin (BTC) Compound Fulcrum And Correlation With Copper
Bitcoin (BTC) is printing a pattern which is a very rare sight in the world of technical analysis. This formation seen on the above daily chart for BTC/USD is called a compound fulcrum. It comprises of an inverse head and shoulders and a head and shoulders trading inside a wedge in the order visible above. дальше »
2018-9-28 17:00 | |
|
|
EOS/USD Price Analysis: Trends of September 24–30, 2018
The price has formed a “pennant” pattern on the daily chart which suggests the probability for the price to fall toward support level of $4.1. The post EOS/USD Price Analysis: Trends of September 24–30, 2018 appeared first on CoinSpeaker. дальше »
2018-9-24 19:18 | |
|
|
Ethereum (ETH) One Step Away From Kicking Off The Altcoin Rally
It is a rare sight in the crypto community to see Ethereum (ETH) in the green after a long queue of weeks in the red. The daily chart above for ETH/USD shows that Ethereum (ETH) is just a single step away from kicking off the altcoin rally. дальше »
2018-9-13 18:30 | |
|
|

Bitcoin Price Analysis: Just Another Pump-Fake or Will BTC Breakout?
Bears remain fully in control of Bitcoin price, yet somehow, the $6,000 support is holding…for now. Bitcoin Price: 4-Hour Chart After posting a daily high at $6,460, bitcoin price fell below the wedge formation and constant rejections at the 20-MA have kept BTC in the pattern of lower lows. дальше »
2018-9-12 13:00 | |
|
|
Bitcoin Price Analysis: How Long Will $6000 Support Hold?
Bears remain fully in control of Bitcoin price, yet somehow, the $6,000 support is holding…for now. Bitcoin Price: 4-Hour Chart After posting a daily high at $6,460, bitcoin price fell below the wedge formation and constant rejections at the 20-MA have kept BTC in the pattern of lower highs. дальше »
2018-9-12 13:00 | |
|
|
Bitcoin (BTC) Price Watch: Still Some Selling Pressure Left?
Bitcoin Price Key Highlights Bitcoin price is still consolidating inside its falling wedge pattern seen on the daily time frame. Price tumbled sharply upon hitting resistance and is setting its sights back on the bottom. дальше »
2018-9-12 06:33 | |
|
|
Ripple (XRP) All Set To Lead Altcoin Rally By October
Ripple (XRP) is probably the most bullish looking coin right now. This is because Ripple (XRP) has already complete an almost 92% correction since its fall from $3. 31 in January this year. In addition to that, as the above weekly chart for XRP/USD shows, Ripple (XRP) has just completed a giant bullish gartley pattern that extends all the way to 2017. дальше »
2018-9-12 00:30 | |
|
|
Bitcoin (BTC) Price Watch: Will Resistance Hold or Fold?
Bitcoin Price Key Highlights Bitcoin price has been on a steady climb recently and is closing in on a nearby resistance level. Price is still trading inside a falling wedge pattern on its daily chart and is about to test resistance around $7,500. дальше »
2018-9-5 06:58 | |
|
|
Bitcoin (BTC) Price Analysis: Long-Term Reversal Pattern Almost Complete
Bitcoin could be in for a major rally as it moves to complete the double bottom pattern on its daily time frame. The post Bitcoin (BTC) Price Analysis: Long-Term Reversal Pattern Almost Complete appeared first on Ethereum World News. дальше »
2018-9-4 06:35 | |
|
|
EOS (EOS) Is On A Bullish Spree Again, But Has It Completed Its Correction Yet?
EOS (EOS) is on a bullish spree again. In fact, EOS (EOS) is one of the first coins to surge as soon as there is any indication of a recovery. This behavior is what has kept EOS (EOS) in the top ten as an investors’ favorite despite being at the centre of debates regarding centralization and ownership. дальше »
2018-8-30 21:30 | |
|
|
Bitcoin (BTC) Price Analysis: Long-Term Reversal Signal?
Bitcoin might be done with its selloff as it could form a double bottom reversal pattern on its daily chart. The post Bitcoin (BTC) Price Analysis: Long-Term Reversal Signal? appeared first on Ethereum World News. дальше »
2018-8-28 07:36 | |
|
|
Bitcoin (BTC): An Interest Rate Hike In September Might Delay A Trend Reversal
Bitcoin (BTC) is about to complete a 69. 81% correction just as it did back in October 2014. What remains to be seen now is whether Bitcoin (BTC) will follow the exact same pattern as in 2014 or trade differently. дальше »
2018-8-26 18:30 | |
|
|
Ethereum Classic (ETC): The Diamond You Didn’t Know Existed
Ethereum Classic (ETC) has long been hailed as a hidden diamond in some crypto circles. This time, the whole crypto community can literally see what it really meant. It is true that Ethereum Classic (ETC) is a rare diamond of a blockchain project, but that is not what we are talking about. дальше »
2018-8-25 21:30 | |
|
|

Bitcoin Cash (BCH) Daily Price Forecast – August 17
BCH/USD Medium-term Trend: Ranging Supply zones: $800, $900, $1000 Demand zones: $300, $200, $100 BCH continues in the range in the medium-term outlook. The bulls lost momentum in the supply area after pushing the coin up to $539. дальше »
2018-8-17 09:13 | |
|
|
Monero (XMR) Daily Price Forecast – August 15
XMR/USD Medium-term Trend: Bearish Supply zones: $200. 00, $210. 00, $220. 00 Demand zones: $60. 00, $50. 00, $40. 00 XMR remains in a bearish trend in the medium-term outlook. The temporal lost in momentum at $79. дальше »
2018-8-15 18:15 | |
|
|
Bitcoin (BTC) Fractal Analysis Shows Bots Still Dominate The Market
Bitcoin (BTC) has fallen sharply in the last 24 hours on news of the SEC delaying its decision regarding the VanEck/SolidX Bitcoin ETF till September. The 4H chart above for BTC/USD shows that while the news served as a catalyst for yesterday’s price action, Bitcoin (BTC) would have eventually followed the same pattern as major trading activity is still dominated by bots. дальше »
2018-8-9 21:30 | |
|
|
Bitcoin (BTC) Price Analysis: Wedge Resistance Holding, Support Next?
Bitcoin is finding resistance at the top of its falling wedge pattern visible on the daily time frame, setting its sights back on support. The post Bitcoin (BTC) Price Analysis: Wedge Resistance Holding, Support Next? appeared first on Ethereum World News. дальше »
2018-8-3 07:40 | |
|
|
IOTA, EOS, Stellar Lumens, Tron, Litecoin Technical Analysis: It’s 2018 Record Lows For IOTA
As fundamentals and coin related news thin out, so are buyers. At current spot prices, altcoins are weak and IOTA, EOS, Tron and XLM sellers are wreaking havoc, reversing last week’s gains. Overly, the bear break out pattern that is so clear in our daily charts might pan out. дальше »
2018-8-3 05:00 | |
|
|
Litecoin (LTC) Daily Price Forecast – July 31
LTC/USD Medium-term Trend: Ranging Resistance Levels: $82, $84, $86 Support Levels: $78, $76, $74 Yesterday, July 30, the price of Litecoin was still in a sideways trend zone. The LTC price made no significant price movement yesterday. дальше »
2018-7-31 12:49 | |
|
|
Has Stellar Lumens (XLM) Finally Broken Out Of The Downtrend?
Stellar Lumens (XLM) is once again on a bull spree as the price has broken out of a triangle on the daily XLM/USD chart and is now expected to surge higher in the days ahead. The last time Stellar (XLM) broke out of a similar triangle, it completed a massive bull run which led to Stellar Lumens (XLM)’s recent ATH. дальше »
2018-7-26 21:30 | |
|
|

Will Bitcoin Follow Gold And SkyRocket With EFT Approval?
Gold is a tangible precious metal whereas Bitcoin is digital. The similarities between them run deep; they are both mined, one physically, the other digitally. Yet if we look closely at the history of gold, Bitcoin is displaying the same behaviour pattern as we’ve seen for gold. дальше »
2018-7-23 12:00 | |
|
|
Tron Falls to Support Level After Huge Price Appreciations – Bullish Ascending Triangle Pattern in Play
Tron had massive price appreciation yesterday which brought it briefly near the $0. 045 level. As price approached the $0. 045 point yesterday, it met strong resistance at the 50EMA and made a strong move back downwards closing very close to the same price level it opened at. дальше »
2018-7-19 20:54 | |
|
|
Ripple (XRP): Striking Similarities Between 2017 And 2018 Fractals
Ripple (XRP) makes all the gains for a whole cycle in a month’s time. In other words, the price corrects for the rest of the year as some investors take profit and others panic sell. While this may seem like a farfetched theory, it is surprising to see how Ripple (XRP) follows the exact same pattern over and over again as demonstrated by the chart for XRP/BTC above. дальше »
2018-7-19 18:00 | |
|
|