Новости о Indicator Technical [ Фото новости ] [ Свежие новости ] | |

Technical Indicator that Predicted Bitcoin Crash to $3.6k in March Is Screaming Sell Again
The Tom Demark (TD) Sequential indicator has proven to be essential in determining Bitcoin’s price action. This technical index was able to predict the most significant exhaustion’s points on BTC’s 1-day chart over the last three months. дальше »
2020-5-5 17:54 | |
|
|
Bitcoin to Form Golden Cross but It Cannot Guarantee a Bull Run
Bitcoin traders are enthusiastic about a textbook technical indicator whose formation could send the asset’s prices higher. Dubbed as Golden Cross, the candlestick pattern will occur when bitcoin’s short-term moving average closes above its long-term moving average. дальше »
2020-2-14 18:00 | |
|
|
Meet Bitcoin Market’s Most Accurate Technical Indicator: Lamborghini
Take a break Golden Cross, bitcoin now has found a better technical indicator in Lamborghini this Valentine’s Day. So it appears, there is a great positive correlation between the cryptocurrency’s price rise and the mention of one of the most beloved sports cars on Reddit. дальше »
2020-2-14 15:50 | |
|
|
Indicator That Signaled Bitcoin’s Bottom at $6,400: Price on Verge of Steep Pullback
If you’ve been involved in Bitcoin or crypto investment at all over the past two years, you likely know of the TD Sequential. The technical indicator, created by Point 72 consultant Tom Demark, has long been a staple of trading suites of crypto investors, giving these individuals a way through which they can figure where... The post appeared first on NewsBTC. дальше »
2020-2-8 05:00 | |
|
|
Bitcoin Explodes as Rare Bull Signal Flashes For the First Time in 10 Months
Bitcoin was trending higher through the early European session on Thursday as a very rare bull signal flashed for the first time in 10 months. Dubbed as Ichimoku Cloud, the technical indicator turned green to identify a long-term upside trend shortly after bitcoin surged towards $9,769. дальше »
2020-2-6 15:00 | |
|
|
Bitcoin Could Hit $13,000 by April 2020, Macro Indicator Shows
Bitcoin could retest the $13,000 range in the next two months, according to a macro technical indicator. The cryptocurrency’s monthly chart shows that it was trending downwards inside a ‘Falling Wedge. дальше »
2020-2-6 18:52 | |
|
|
Historically Accurate Bitcoin Price Indicator Just Signaled Start to a Long-Term Bull Market
A historically accurate bitcoin price indicator has just flipped its market bias to bullish after four months. Dubbed as Guppy Multiple Moving Average, or Guppy, the technical indicator identifies changing trends and potential price breakouts by adjoining an asset’s long and short term moving averages. дальше »
2020-1-27 15:00 | |
|
|
This technical indicator that forecasts when Bitcoin is about to turn parabolic just flashed
Despite falling into a bout of sideways trading over the past several days and weeks, Bitcoin (BTC) and the aggregated cryptocurrency markets have been able to post massive gains from their late-2019 lows. дальше »
2020-1-26 01:00 | |
|
|
Bitcoin Indicator that Crashed Price to $3.1K Returns: The Dreaded Death Cross
Bitcoin is looking to repeat a technical pattern that crashed its price to $3,120 in late 2018. The leading cryptocurrency by valuation made a rebound from levels near $13,920 during June 2019. It plunged by more than 53 percent in the later sessions, falling to establish a local bottom towards $6,410. дальше »
2020-1-22 17:31 | |
|
|
This Simple Chart Divulges Where the Gold Price Goes from Here
Gold's price is eyeing a recovery on Friday, but a key technical indicator could dictate the next major trend. The post This Simple Chart Divulges Where the Gold Price Goes from Here appeared first on CCN.com дальше »
2020-1-18 20:52 | |
|
|
These altcoins could soon pullback before continuing bullish trend
Over $28 billion flooded the cryptocurrency market in the last 24 hours. Despite the massive inflow of capital that pushed the entire market up, a technical indicator estimates that Ethereum, Litecoin, and EOS could soon retrace before continuing their bullish trends. дальше »
2020-1-15 23:30 | |
|
|
Bitcoin’s bull run may have started last week based on this technical index
Bitcoin could have entered a new bull market last week based on a technical indicator that has been extremely effective at determining previous parabolic movements. Determining the trend’s direction In a recent tweet, Sawcruhteez, a financial analyst and swing trader, emphasized that the parabolic SAR presented a buy signal on BTC’s 1-week chart. дальше »
2020-1-13 21:00 | |
|
|
Bitcoin Indicator That Called Rally to $14,000 Flashes Again
Once again, analysts have started to flip bullish on Bitcoin again. Sure, the cryptocurrency is still down some 40% from its $14,000 peak from last year, but per a number of traders, an array of key technical indicators have suggested that BTC is ready to return higher once again. дальше »
2020-1-13 04:00 | |
|
|
Litecoin Prepares Retracement before Continuing Bullish Trend
A technical indicator estimates that Litecoin could be bound for a correction. Litecoin Technical Analysis The recent rally that has pushed Litecoin’s price up nearly 33 percent since Jan. 3 may soon find an exhaustion point. дальше »
2020-1-12 20:15 | |
|
|
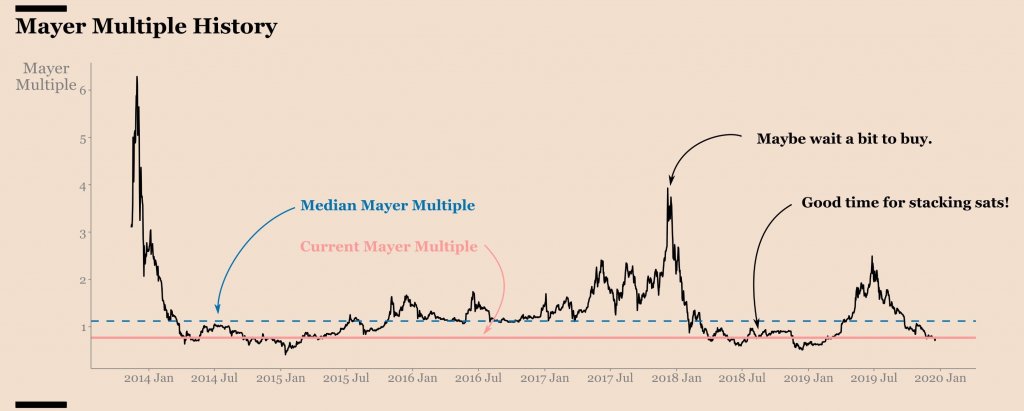
Key indicator shows it’s time to accumulate Bitcoin, but the bottom is far ahead
Despite the high levels of volatility seen yesterday, Bitcoin stabilized around $7,200. Now, a renowned technical analyst suggests that it is a good time to be “stacking sats” while another estimates a further correction. дальше »
2019-12-20 00:36 | |
|
|
Bitcoin At Risk Of 12 More Months Of Bear Hibernation, Possible Lower Low
Bitcoin’s downtrend is showing no signs of stopping, and one important and commonly-used technical analysis indicator suggests that there may not be an end in sight until another 12 or more months of bear market price action and consolidation takes place. дальше »
2019-12-12 20:00 | |
|
|

Bitcoin Price: ‘Legendary’ Golden Cross Could Push BTC to New Peak in 2020
A legendary long term bitcoin price technical indicator could pave the way for brighter days ahead next year. Bitcoin Price Poised For Big Move The short term picture for BTC is pretty grim. Since its peak this year the digital asset has corrected 47% to current prices. дальше »
2019-12-11 11:00 | |
|
|
Key Technical Indicator Signals Buying Opportunity For Bitcoin
Last weekend, Bitcoin resurfaced from the $9,000 and $10,000 zone it was priced at for almost two weeks to trade at the $11,000 price level. While the latest surge in price has been primarily attributed to the U. дальше »
2019-8-8 11:03 | |
|
|
Willy Woo’s Bitcoin Difficulty Ribbon Suggests Drop Below $6,000/BTC “Very Unlikely”
On-chain metrics analyst Willy Woo believes we may never see another $6,000 Bitcoin again. The trader bases his theory on his latest technical indicator, the Bitcoin Difficulty Ribbon. Woo argues that a miner capitulation he expects to see in 2020, along with the halving of Bitcoin supply next May, will “add more fuel to the. дальше »
2019-8-8 00:00 | |
|
|
Crypto Analyst: Bitcoin Technical Indicator Struggles At This Range Before Bull Run
All across the crypto community talk of Bitcoin’s next bull run is consuming most discussion. Everyone is looking for clues or signs that could support the theory that the next bull run is getting its footing right now, and could take Bitcoin price to a new all-time high. дальше »
2019-7-3 04:00 | |
|
|
Bitcoin Hits Resistance But Long Term Technical Indicator Flips Green
Total crypto market capitalization is back at its 2019 high as Bitcoin maintains gains and grinds slowly higher. There is a lot of resistance approaching, however, and analysts are starting to wonder when the next altseason will start to kick in. дальше »
2019-6-18 11:30 | |
|
|
Google Trends Bitcoin Searches, a Key Price Indicator, Turn Mega Bullish
By CCN Markets: On June 7, Coin Street News (@CoinStreetNews) shared a chart on Twitter that could have serious implications on bitcoin’s price action. The account specializes in technical analysis of cryptocurrencies and other assets. дальше »
2019-6-14 18:40 | |
|
|
Crucial Bitcoin Indicator Signals End of Bear Market, is BTC in Danger of Falling Back?
Although the crypto markets have been in a firm uptrend over the past month or so, most major cryptocurrencies have begun incurring some levels of selling pressure over the past several days that appears to have put Bitcoin (BTC) and the aggregated market’s momentum in jeopardy. дальше »
2019-6-4 01:00 | |
|
|
Bitcoin technical analysis, is a pullback on the way?
Bitcoin has gone through a significant bullish movement that has seen its price rise 190 percent since the low of Dec. 15, 2018, when it was trading at $3,130. Now that it has been struggling to break $9000, BTC could be preparing for a downturn. дальше »
2019-6-3 13:38 | |
|
|
Bitcoin Bulls Are Skeptical Even After Bullish Signal, Will $8,500 Hold?
Bitcoin prices firm above $8,500 Technical analysts are overly bullish after Guppy indicator turned green After three years, the Guppy technical indicator is flashing “buy. ” As a result, technical analysts believe bulls are in control. дальше »
2019-5-28 20:00 | |
|
|
Bitcoin Bull Market Confirmed? Key Technical Indicator Turns Green in 3 Years
It takes a long time for a trend to reverse. There can be bull traps and fake outs as we witnessed during 2018 when things were on a downward slope. One long term technical indicator has just turned green and the last time it did so, a two year up trend followed. дальше »
2019-5-28 11:30 | |
|
|
Bitcoin Price Exploded in 25-Month Bull Rage the Last Time This Happened
By CCN: According to technical analyst Josh Rager, the 3-day Guppy Multiple Moving Average (GMMA) on the bitcoin price trend has turned green following bitcoin’s recent rally. The last time this technical indicator signaled a change in trend, it led to a 25-month bull run. дальше »
2019-5-28 10:23 | |
|
|
Bitcoin Price Chart: Technical Indicator Gives 5th Ever Parabolic Signal
While Bitcoin price is struggling with overhead resistance at the moment and taking a much needed breather from its bullish rally that began in early April with a $1,000 green candle, the cryptocurrency may have a lot more parabolic momentum left, according to one specific technical indicator. дальше »
2019-5-21 03:01 | |
|
|
Crypto Trader, Tech CEO: This Indicator Could Signal a “Prolonged Bull Market”
The Bitcoin price has been doing rather well of late. The number one digital asset has surged more than 100 percent in 2019 alone and many crypto market analysts are calling for more upside to come. дальше »
2019-5-16 02:00 | |
|
|
This Technical Indicator Predicts Bitcoin above $300K by 2021
The bitcoin price could discover new highs above $300,000 by 2021, according to a popular technical indicator. Dubbed as the Stochastic RSI, the indicator helps investors identify oversold and overbought conditions inside the market. дальше »
2019-5-12 19:00 | |
|
|

Technical Indicator Signals That The Bitcoin (BTC) Bear Market May Be Over, But What Comes Next?
Bitcoin has been able to incur significant upwards momentum over the past 24-hours that has extended into the past couple of hours despite facing some downwards pressure earlier today. Despite BTC’s upwards surge, the general. дальше »
2019-5-8 01:53 | |
|
|
Bitcoin [BTC]: Coin’s rally has begun, claims Peter Brandt on the basis of past data, technical indicator
Peter Brandt, an old school trader and author of “Diary of a Professional Commodity Trader,” posted a tweet suggesting that Bitcoin’s rally might have begun. Brandt tweeted, “The last time Factor’s benchmark weekly MA was in the current profile of turning from down to up was in Nov 2015 just as $BTC began its move […] The post Bitcoin [BTC]: Coin’s rally has begun, claims Peter Brandt on the basis of past data, technical indicator appeared first on AMBCrypto. дальше »
2019-5-4 22:30 | |
|
|
Bitcoin Jumps 4% to New 2019 High Boosted by $20,000 Trigger Indicator
By CCN. com: The bitcoin price has increased from $5,341 to $5,587 on Coinbase, getting close to surpassing a 2019 high at $5,594. In some crypto major markets, the bitcoin price surged past $5,600. дальше »
2019-5-3 11:51 | |
|
|

Delphi Digital's Latest Report Says Bitcoin’s Market Cycle Is Right on Track
Delphi Digital has returned with another installment of its unspent transaction output (UTXO) reports. Recalling its report from January of this year, the research firm says bitcoin’s market cycle is right on track. дальше »
2019-5-3 18:44 | |
|
|
Once in a Decade: Amazon Stock Sees Golden Cross, Bullish Indicator
By CCN: In the past 30 days, Amazon’s stock (AMZN) has increased from $1,500 to $1,926 year-to-date, surging by more than 28. 4%. The strong momentum of AMZN led a key technical indicator called the short-term 50-day moving average to surpass a long-term 200-day moving average, flashing the infamous “golden cross. дальше »
2019-5-1 18:00 | |
|
|
Bitcoin Technical Indicator Flashes Sell Signal, Suggests Further BTC/USD Price Downside
Bitcoin is currently trading at $5,248 with 24-hours losses of 0. 95 percent, as per Coinmarketcap. While BTC/USD is trading at around $5,150, there is still a 6 percent difference between the price it is trading on Bitfinex at $5,483, at the time of writing. дальше »
2019-4-30 20:18 | |
|
|
Technical Indicator Suggests Tether Trouble Has Put an End to Bitcoin Rally
This week, a scandal involving Bitfinex and Tether parent company iFinex being accused by the New York Attorney General’s office of misappropriating funds has shaken up the cryptocurrency market. Bitcoin and other cryptocurrencies have rallied in recent months, however, the latest negative news surrounding the leading stablecoin on the market has been enough to cut. дальше »
2019-4-30 03:01 | |
|
|
Bitcoin Momentum Fails, Bearishly Overbought for the First Time Since 2017
By CCN. com: According to a cryptocurrency trader, a technical indicator of bitcoin is signaling a potential downturn in the market for the first time since December 2017. The indicator, known as the Relative Strength Indicator (RSI) bearish divergence, signals a bearish downtrend and a decline in momentum. дальше »
2019-4-29 13:19 | |
|
|

Bitcoin (BTC) Technical Signal That Has Predicted Historical “Moons” Is Flashing
Bitcoin Looking Bullish Bitcoin may have dropped by 2% in the past 24 hours, but analysts have kept their heads up high. According to analyst Nunya Bizniz, a technical indicator used by prominent institutional trader-turned-Bitcoin. дальше »
2019-4-25 05:00 | |
|
|
Technical Indicator Signals That Bitcoin (BTC) May Be on the Verge of a Bull Run
The crypto markets have dropped slightly today after tepidly climbing higher over the past week. Despite this, Bitcoin (BTC) has been able to firmly establish its position within the $5,000 region and has not incurred any significant selling pressure after climbing towards $5,300. дальше »
2019-4-22 00:30 | |
|
|
Key Bitcoin Indicators Rage Bullish as Crypto Gains $40 Billion in 1 Month
By CCN. com: Over the past 24 hours, the bitcoin price briefly surpassed the $5,300 mark in a short-term spike but retraced back to the $5,200 region. In the past 30 days, as the bitcoin price gained 31. дальше »
2019-4-19 11:54 | |
|
|
Bullish signal suggests the bottom is in for bitcoin, says technical analyst
A trading indicator in the bitcoin markets suggests the bottom may be in, according to one technical analyst. The two-week MACD of bitcoin crossed into a buy signal on Apr. 1st, the first time since May 11th, 2015, the bottom of the market before it exploded in 2016-2017. дальше »
2019-4-18 09:59 | |
|
|
Bitcoin / USD Technical Analysis: Critical Round
Bitcoin has a bullish short-term outlook, with the BTC / USD pair regaining bullish momentum above the $5,100 level The four-hour time frame shows a bearish head and shoulders pattern The Ichimoku indicator on daily time frame is showing that the $5,200 level is an important pivot Bitcoin / USD Short-term price analysis Bitcoin has […] The post Bitcoin / USD Technical Analysis: Critical Round appeared first on Crypto Briefing. дальше »
2019-4-18 17:12 | |
|
|