Ethereum Transaction Fees Near Six-Month Low Amid Declining Prices

2022-4-19 02:00

Ethereum gas prices have been declining for a while now. It had risen to its all-time high back in 2021 when the bull market was in full bloom. It then continued to maintain on the high spike, spiking at various intervals to high points. At its highest, average ETH gas fees were as high as $69. However, with the recent downtrend and the market losing momentum, the gas fees have crumbled and the recent decline has seen its near six-month lows.

Ethereum Fees Are Down

Ethereum gas fees for the last three months showed a consistent downtrend that saw average gas fees decline as low as $5.98 in early March. This had been the lowest that gas fees had been in seven months at this point. However, a spike in gas fees in early April would quickly put an end to this sending gas fees as high as $43 once more. This would prove to be only temporary given that the sharp downtrend that followed has sent ETH gas fees to plummet towards six-month lows.

Related Reading | DeFi Stablecoin Platform Beanstalk Suffers ~$80M Hack

As of Monday, Ethereum gas fees had declined as low as $8.78 on average. It represented a 76$% drop from its April high to put it in levels recorded in early March. The drop in ETH fees has also translated to a drop in the fees of Layer 2 rollups which boast significantly lesser fees than it costs to transact on the main network. 

The lowest recorded fee rate had dropped to as low as $0.03 per transaction on Sunday recorded on Metis Network. Others like Loopring and Zksync had seen transaction fees slide to as low as $0.05.

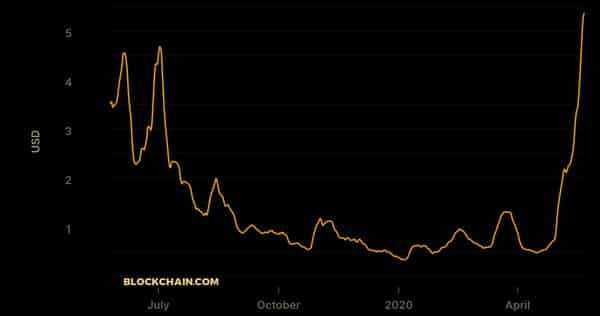
Bitcoin fees had also fallen and the average transaction fee as of early Monday sat at $1.04.

ETH On The Charts

The current downtrend seems to be prominent in not just the transaction fees but the price of the digital asset. Ethereum price had crashed below $3,000 in the early hours of Monday, and while small recoveries were made, various dips saw the digital asset touch the $2,800 price range before the opening of the markets on Monday.

Related Reading | TA: Ethereum Slides Below 3K, Why Bears Could Aim $2.5K

With selloffs rocking the market, indicators had turned inherently bullish for the digital asset, skewing completely in favor of the sellers. After breaking the $3,000 mark, the next major support level now lies at $2,900 although bears continue their efforts to drag it down lower. 

ETH has now fallen below the 50-day moving average. This puts the short-term forecasts of the cryptocurrency right in the negative for the majority of traders, and the long-term outlook is not looking good either. The digital asset is trading at $2,909 at the time of this writing.

Featured image from Shrimpy Academy, chart from TradingView.com origin »

Bitcoin price in Telegram @btc_price_every_hour

High Voltage (HVCO) на Currencies.ru

$ 0.0012187 (+0.56%)
Объем 24H $0
Изменеия 24h: 0.13 %, 7d: -0.82 %
Cегодня L: $0.0012066 - H: $0.0012233
Капитализация $0 Rank 8594
Цена в час новости $ 0.0147322 (-91.73%)

high prices declining ethereum full market bloom

high prices → Результатов: 126


Фото:

Bitcoin’s Pattern Breakout Fails to Clear Overhead Resistance

The Bitcoin (BTC) price has been decreasing since it reached a high of $9,379 on July 7. Today, it broke out from a descending wedge, but could not sustain the higher prices. Bitcoin Short-Term Breakout The hourly chart for BC reveals that the price has been decreasing since a high of $9,379 reached on July […] The post Bitcoin’s Pattern Breakout Fails to Clear Overhead Resistance appeared first on BeInCrypto.

2020-7-8 11:55


Фото:

Could Bitcoin’s Next Halving Be a ‘Non-Event’ Compared to 2016?

With less than three weeks to go until the next highly-anticipated Bitcoin halving, cryptoasset markets are still in a weakened state leading analysts to suggest it could be a total ‘non-event.’ Bitcoin prices have climbed to another weekly high this week, but markets still remain generally bearish as technicals are still painting a downtrend on longer […] The post Could Bitcoin’s Next Halving Be a ‘Non-Event’ Compared to 2016? appeared first on BeInCrypto.

2020-4-25 00:10


Фото:

Bitcoin’s Price Action Resembles a Bearish Wyckoff Distribution

On March 20, the BTC price reached a high of $6,900. Since then, it has been mostly trading in a range between $6,100-$6,900, with the exception of a failed breakdown attempt on March 27. On April 2, the price initiated a rapid upward move and reached a high of $7,192, however, the higher prices could […] The post Bitcoin’s Price Action Resembles a Bearish Wyckoff Distribution appeared first on BeInCrypto.

2020-4-3 17:10


Фото:

Is Bitcoin Moving in an Ascending Triangle or Wedge?

On April 2, the Bitcoin price initiated a very swift upward move, rallying from a low of $6,551 to a high of $7,194. While initially, it seemed that this movement would cause a breakout above the current pattern, the higher prices could not be sustained and BTC reached a close of $6,794, slightly below the […] The post Is Bitcoin Moving in an Ascending Triangle or Wedge? appeared first on BeInCrypto.

2020-4-3 13:45


Фото:

Bitcoin Addresses With Non-Zero Balances Hit All-Time High

The number of new Bitcoin addresses with a non-zero balance is at an all time high, surpassing the number of new addresses hodling BTC when prices hit $20K back in 2017. Bitcoin’s Richest addresses: Not as many as you might think Twitter user @IncomeSharks shared charts from Bitcoin onchain metrics API and Data site Glassnode Studio today, which show a logarithmic representation of address growth across a range of different metrics. One chart shows thatRead More

2020-2-22 01:00