2019-4-6 21:30 |
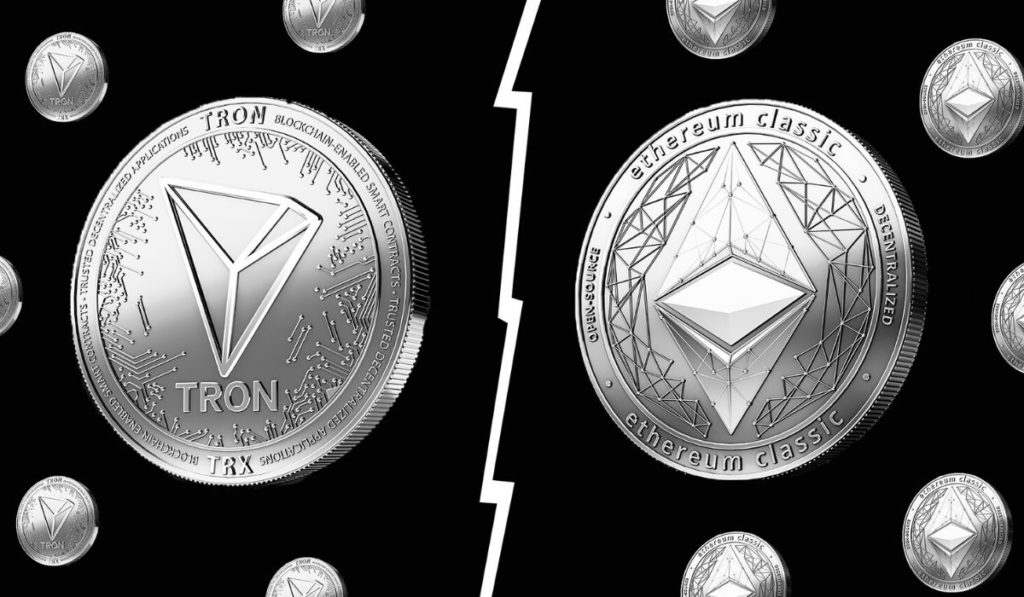
The prices and market caps of the cryptocurrency market were subjected to successive changes over the course of the week after Bitcoin [BTC] saw its value shoot up massively. Following BTC’s spike, the rest of the market followed suit, including Ethereum [ETH] and Tron[TRX]. The rivals had contrasting fortunes, with Ethereum benefiting well whereas Tron failed to climb the charts.
Ethereum 1 day
Source: TradingView
The second-largest cryptocurrency could not overturn the prevalent downturn that lowered the price from $221.20 to $144.07. The long term support was at $80.55.
The Bollinger bands were diverging from each other after the recent price outbreak. The size of the Bollinger cloud had also increased, when compared to recent time-frames.
The Awesome Oscillator showed slight momentum on the graph, after being negligible for some time. The spike on the graph indicated an increase in market momentum.
The Chaikin Money Flow indicator was above the zero line, suggesting that the capital coming into the market was more than the capital leaving the market.
Tron 1 day
Source: TradingView
Tron’s one day graph displayed an uptrend that raised the price from $0.0131 to $0.0244. The support held at $0.0119.
The Parabolic SAR was above the price candles during the time of writing, meaning that Tron was going through a bearish phase.
The Relative Strength Index was close to the overbought zone, a sign of the buying pressure being more than the selling pressure.
The MACD indicator was bullish after the signal line spiked above the histogram. The MACD histogram, on the other hand, was a mix of both bearish and bullish signals.
Conclusion
The sudden surge in prices that the cryptocurrency market enjoyed had dissipated, keeping the value of coins steady. All the above-mentioned indicators projected that sideways movement had crept back into the cryptosphere.
The post Ethereum [ETH/USD] and Tron [TRX/USD] Price Analysis: Coin prices settle as bullish effect wears off appeared first on AMBCrypto.
origin »Market.space (MASP) на Currencies.ru
|
|


