2019-4-20 21:30 |
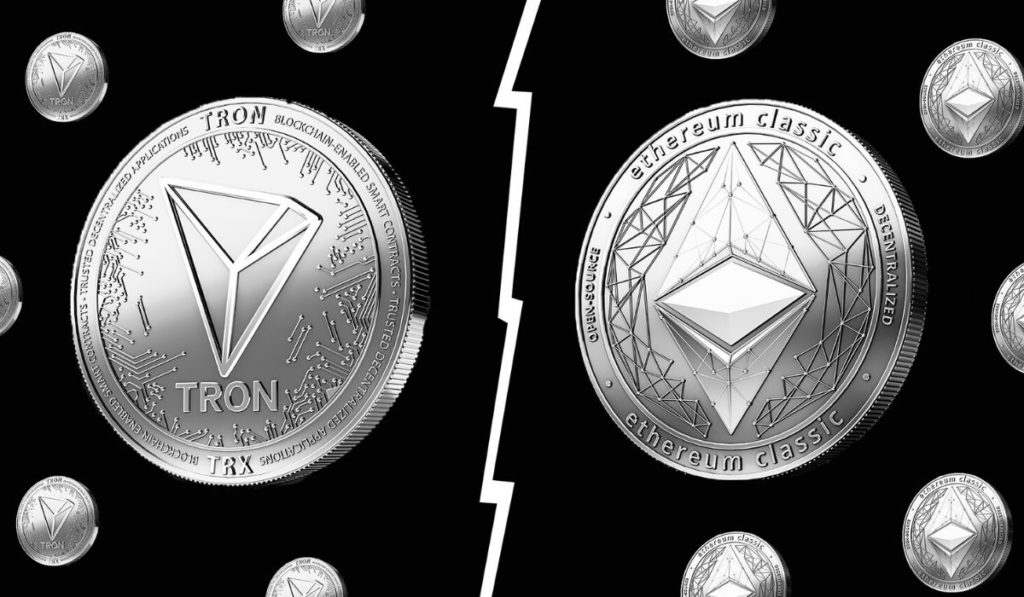
Ethereum and Tron communities seem to be putting their differences aside, with the recent tweets between Tron’s Justin Sun and Ethereum’s Vitalik Buterin pointing at a possible partnership in the future.
Tron has been slowly succeeding in scaling while Ethereum is finding it difficult to do so. Tron’s transaction count crossed that of Ethereum to reach an all-time high, which further showed the efficiency of Tron as compared to that of Ethereum.
Ethereum 1-Day Chart
Source: TradingView
Source: TradingView
Support 1: $80.72
Resistance 1: $181.63
Resistance 2: $248.64
Resistance 3: $318.18
Resistance 4: $478.76
The Bollinger Bands showed that the widening of the bands had ceased, indicating that volatility had started to seep out of the market. The prices seemed to be moving towards the simple moving average, which indicated bearish momentum for ETH.
The Chaikin Money Flow indicator was crawling towards the zero-line, indicating that the strength of buyers was diminishing slowly.
The Stochastic RSI showed that the Stochastic line had dipped into the oversold zone, and made a comeback, indicating bullish momentum for ETH.
Tron 1-Day Chart
Source: TradingView
Support 1: $0.0119
Resistance 1: $0.0267
Resistance 2: $0.0396
For TRX, the Bollinger Bands were slowly converging. TRX’s price was trading along with the simple moving average.
The Chaikin Money Flow indicator crossed the zero-line, implying a reduction in the money flow.
The Stochastic RSI for Tron had dipped into the oversold zone, indicating a massive bearish pressure.
Conclusion
TRX prices were being pushed to the depths by bearish pressure, as indicated by Bollinger Bands, Chaikin Money Flow and Stochastic RSI, however, the same indicators showed a bullish scenario for Ethereum.
The post Ethereum [ETH] vs Tron [TRX] Price Analysis: TRX in bear’s territory as ETH sees unprecedented bullish move appeared first on AMBCrypto.
origin »Bitcoin price in Telegram @btc_price_every_hour
Ethereum (ETH) на Currencies.ru
|
|


