Crypto / CHART (ChartEx)
Bitcoin price in Telegram @btc_price_every_hour
ChartEx CHART = 0. BTC = 0.00 РУБ
Последние новости о ChartEx (CHART) |
This Chart Explains Why the RENDER Price Could Be Ready for a Rally to $13
A technical analysis of RENDER’s price action against USDT reveals compelling evidence for a potential surge to the $13 mark. Based on the chart posted by CyrilXBT on X, the cryptocurrency has established a clear breakout pattern from its previous consolidation zone between $6 and $8, accompanied by robust trading volume that validates the move’s […] The post This Chart Explains Why the RENDER Price Could Be Ready for a Rally to $13 appeared first on CaptainAltcoin. дальше »
2024-12-11 01:00
|
|
According to This Chart Pattern, An End-of-Year Rally Could Be in the Cards for Shiba Inu (SHIB)
Shiba Inu climbed 9% to $0. 00001908 over the week. SHIB’s technical chart has shown recent strength, giving investors confidence that the project can continue rising. Could this momentum fuel a huge end-of-year rally? This chart pattern echoes yes. дальше »
2024-11-13 17:17
|
|
Bitcoin (BTC) Price Must Close Above Crucial Support This Week or Risk Another Decline to $55k
Rekt Capital released an analysis of the current price action of Bitcoin (BTC). The weekly timeframe chart reveals a descending channel, characterized by black lines. The upper boundary of this channel has consistently acted as a resistance zone, as indicated by red circles on the chart. дальше »
2024-10-24 22:00
|
|
Mixed signals flash on FLOKI’s chart amid bullish momentum - What now?
While the token appears positioned for further gains, technical indicators suggest a potential minor pullback. Market metrics present a mixed outlook on FLOKI's price direction, reflecting unceThe post Mixed signals flash on FLOKI’s chart amid bullish momentum - What now? appeared first on AMBCrypto. дальше »
2024-10-15 11:30
|
|
This Chart Indicates Bitcoin May Be Headed for Record Highs Above $73K
The Three-line break chart, which filters out noise and erratic price movements, suggests the broader bull run has begun. дальше »
2024-10-15 07:40
|
|
Aptos crypto rises 8.8% in 24 hours: Weekly chart signals more gains
APT has a strongly bullish outlook in the coming weeks. The short-term bias was also bullish but BTC volatility could damage it. Aptos [APT] has a bullish structure on the weekly chart and mThe post Aptos crypto rises 8. дальше »
2024-10-4 01:00
|
|
Peter Brandt Clashes With Peter Schiff Over BTC/Gold Debate
Renowned financial experts have opposite views on exact same chart дальше »
2024-9-8 17:12
|
|
Peter Brandt: Take This Bitcoin Chart 'Seriously'
Peter Brandt shares extremely important Bitcoin chart дальше »
2024-8-8 13:33
|
|
Bitcoin (BTC) Facing Imminent Death Cross
That said, the ominous chart pattern could be a lagging indicator дальше »
2024-8-8 08:15
|
|
Is the Bitcoin Rainbow Chart showing large gains in August?
The Bitcoin rainbow chart showed intense bullishness for BTC over the next 12–18 months Market sentiment was lukewarm and public frenzy hasn't gotten rolling, even though prices were just belThe post Is the Bitcoin Rainbow Chart showing large gains in August? appeared first on AMBCrypto. дальше »
2024-7-30 06:00
|
|

Notcoin (NOT) Develops Falling Wedge Triangle: Rally Looms?
Notcoin (NOT), a relatively new entrant in the cryptocurrency market, has recently formed a falling wedge pattern on its price chart. This technical formation is characterized by converging trendlines that slope downwards, signaling a potential bullish reversal. дальше »
2024-6-10 14:30
|
|
Here’s Why Wormhole (W) is Poised for Massive Gains: Expert Likens W’s Chart to $SUI, $SEI, and Optimism (OP)
Wormhole (W) is gearing up for market advancements, underscored by its strong chart structure that expert Alex Wacy likens to that of $SUI, $SEI, and Optimism (OP). This correlation is crucial as it suggests a similar trajectory could be on the horizon for Wormhole, especially with the impending launch of its $ZRO token, which positions […] The post Here’s Why Wormhole (W) is Poised for Massive Gains: Expert Likens W’s Chart to $SUI, $SEI, and Optimism (OP) appeared first on CaptainAltcoin. дальше »
2024-5-4 09:15
|
|
PENDLE Expert Points to Potential Rebound Levels Following 25% Price Dip, But There’s a Catch
Crypto analyst Stoic tweeted a keen observation on Pendle (PENDLE), highlighting its latest market behavior on a 4-hour chart. The analyst’s latest post is coming after the token has dipped by more than 25% in the last 1 week. дальше »
2024-5-3 18:15
|
|
Which Meme Coin Will Rule the Chart in April? Top 3 Predictions Amid Dogwifhat Crash
The Dogwifhat dip is only the beginning. A steeper crash is on the horizon. The third position on the meme coin chart is highly dynamic and prefers a new face every few weeks. Having ballooned up its market cap beyond $4B already, WIF is expected to fall prey to a long and tedious price correction […] The post Which Meme Coin Will Rule the Chart in April? Top 3 Predictions Amid Dogwifhat Crash appeared first on CaptainAltcoin. дальше »
2024-4-5 21:30
|
|
Crypto Analyst Identifies Potential ONDO Breakout Opportunity: Here’s His Outlook
Cryptocurrency trader Daan Crypto Trades has identified an intriguing chart pattern for the ONDO token that could present a buying opportunity if broader market conditions are favourable. ONDO’s Intriguing Chart Pattern According to Daan Crypto Trades, the chart for the ONDO cryptocurrency against the USDT stablecoin presents an intriguing setup. дальше »
2024-4-4 23:15
|
|
Bitcoin could rally once more - Watch out for this on USDT's chart
The stablecoin supply ratio hinted at a bearish sentiment. The Tether Dominance chart could be useful for determining BTC's local top Bitcoin [BTC] formed a range after crossing the $50k thrThe post Bitcoin could rally once more - Watch out for this on USDT's chart appeared first on AMBCrypto. дальше »
2024-2-27 09:30
|
|
As Bitcoin (BTC) Charges On, This AVAX Metric May Signal Price Dips for Altcoins – But There’s a Catch
Cryptocurrency analyst Altcoin Sherpa warned regarding the potential for heavy capitulation across the altcoin market if key support levels fail. AVAX Chart Signals Broad Market Troubles In a tweet post, he highlighted Avalanche’s AVAX token as an important chart to monitor, cautioning that a decisive breakdown could spark a crisis of confidence rippling across cryptos […] The post As Bitcoin (BTC) Charges On, This AVAX Metric May Signal Price Dips for Altcoins – But There’s a Catch appeared first on CaptainAltcoin. дальше »
2024-2-24 23:30
|
|
SOL/USDT technical analysis: Solana chart analysis points to a continued rally
SOL/USDT chart and technical analysis Solana is recovering from the recent drop and has closed above the previous high of 102. 60. The price is expected to continue the rally ahead as the market structure is turning bullish. дальше »
2024-2-1 21:04
|
|
XRP Braces for Breakout or Breakdown as Crucial Chart Pattern Looms
XRP next move might be decided by this impending chart formation дальше »
2024-1-28 12:53
|
|
Bitcoin Versus M1 Money Supply: The Most Bullish Chart Yet
Bitcoin price is at roughly $37,000, gaining more than $10,000 over the last month. The BTCUSD chart is beginning to look a lot more bullish. However, the most chart you’ll ever see is the top cryptocurrency by market cap compared against the money supply. дальше »
2023-11-10 19:32
|
|
Top Chart Patterns for Analyzing Cryptocurrency Trends
In the volatile world of cryptocurrency trading, recognizing chart patterns can provide valuable insights into potential future price movements – and plays a crucial role in helping traders make informed decisions. дальше »
2023-10-31 14:00
|
|
Ethereum/Bitcoin Chart is ‘The Most Important’ for Altcoins According to Miles Deutscher – Here’s His Outlook
The ETH/BTC ratio remains a crucial chart to watch when assessing the altcoin market outlook, according to crypto analyst Miles Deutscher. With Bitcoin range-bound between $30,000 and $40,000, Deutscher notes that Ethereum needs to reclaim the 0. дальше »
2023-10-27 11:30
|
|
Analyst Eyes $72K Bitcoin on Bullish Chart Pattern, Predicts End of the Year BTC Price
Crypto YouTuber Crypto Rover highlighted an emerging head and shoulders pattern on the Bitcoin chart that could propel the price back toward its all-time high if it activates. In a recent tweet, Rover pointed out the developing head and shoulders formation taking shape on the Bitcoin weekly chart. дальше »
2023-10-12 20:30
|
|
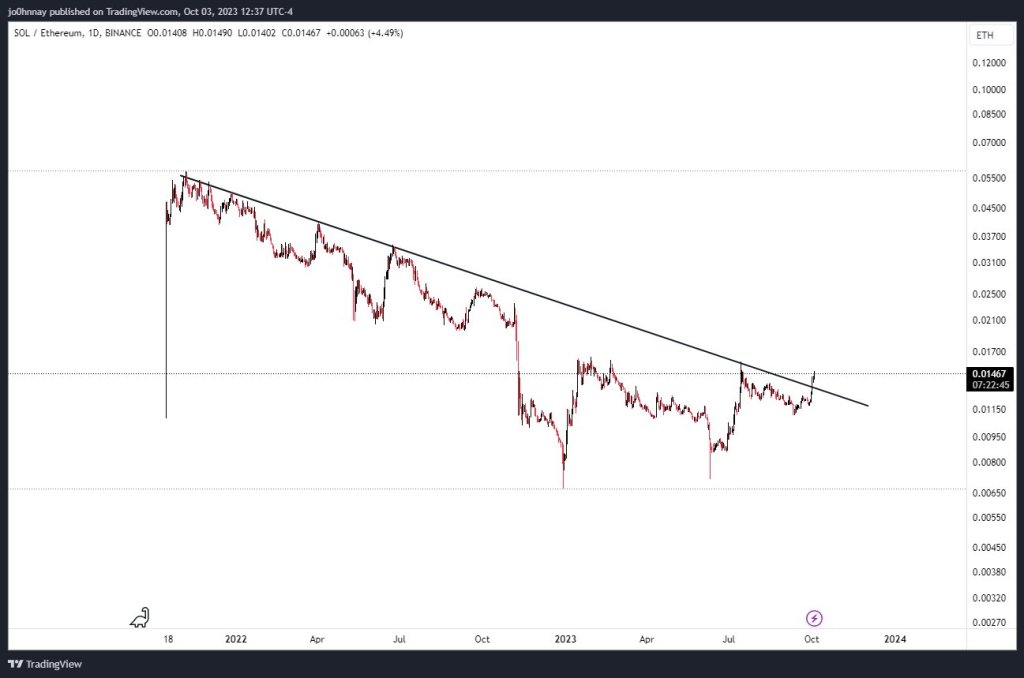
This Chart Is Pro-Solana: Is It Time To Sell ETH For SOL?
For the last two years, Ethereum (ETH) has outperformed Solana (SOL), looking at the performance in the weekly chart. However, according to one technical analyst on X, this is about to change, especially considering the candlestick arrangement of the SOLETH chart on the weekly chart. дальше »
2023-10-5 04:00
|
|
This Ethereum (ETH) Chart Unveils Unique Upside Potential
The ETH/USD chart is bearish while the ETH/BTC chart turns bullish.
The post This Ethereum (ETH) Chart Unveils Unique Upside Potential appeared first on BeInCrypto.
дальше »2023-9-7 12:17
|
|
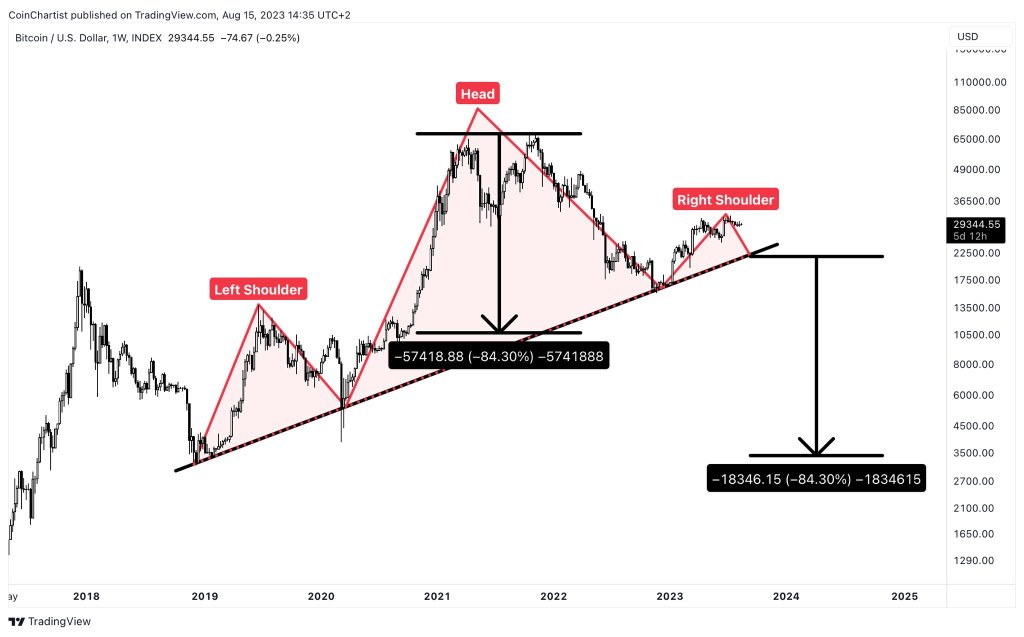
This Dreaded Candlestick Formation Just Printed: Bitcoin To $18k?
Bitcoin, the most valuable crypto asset, is at a critical juncture at spot rates if candlestick formation in the weekly chart is anything to go by. One analyst on X, formerly Twitter and NewsBTC Editorial Director Tony Spilotro, is sounding the alarm after picking out the bearish head-and-shoulder pattern in the weekly chart. дальше »
2023-8-16 03:00
|
|
Ethereum Bears Set Their Sights On Next Downside Target If $1,700 Support Breaks
The price of Ethereum is currently on a downtrend and is approaching a significant support level. In the past 24 hours, there has been little movement on the chart, while on the weekly chart, ETH has experienced a depreciation of over 3%. дальше »
2023-6-13 22:00
|
|

Bitcoin price chart flashes a bullish sign that could lead to breakouts in ADA, QNT, RNDR and RPL
BTC’s chart is beginning to look bullish, and ADA, QNT, RNDR and RPL could rally if Bitcoin price breaks out to the upside.
дальше »2023-6-5 20:18
|
|
Aptos in a downtrend, but this indicator showed a reversal was possible
Disclaimer: The information presented does not constitute financial, investment, trading, or other types of advice and is solely the writer’s opinion. The 4-hour chart showed momentum and strucThe post Aptos in a downtrend, but this indicator showed a reversal was possible appeared first on AMBCrypto. дальше »
2023-5-20 19:30
|
|
Bitcoin Bull Run In Jeopardy As Parabolic SAR Flips Bearish On Daily Chart
Bitcoin (BTC), the world’s largest cryptocurrency, is facing a potential correction as it loses support at a critical level and trades at $27,300. Technical analysis shows that the Parabolic SAR has flipped bearish on the daily chart, indicating a possible downturn shortly. дальше »
2023-5-9 01:00
|
|
XRP Trades Near Crucial Support Of $0.46, Will This Level Hold?
During the past week, the price of XRP has suffered significant losses due to a powerful selling wave. While the one-day chart reflects a 3% increase, the weekly chart shows a decline of over 12%. Buyers have faced resistance in the $0. дальше »
2023-4-26 17:00
|
|
Bitcoin's Ascending Triangle Pattern on Daily Chart Signals Potential Breakout
Bitcoin's daily chart recently displayed ascending triangle pattern, bullish technical indicator that suggests potential price breakout in near future дальше »
2023-4-19 12:01
|
|
LDO Registers 7% Gains On Weekly Chart, More Gains Ahead?
While top cryptocurrencies are trading in the red zone, with most giving up their past week’s gains, Lido DAO (LDO) has held on to its gains. The token maintains an over 7% price increase on the weekly chart, reflecting its resilience against the ongoing bearish trend. дальше »
2023-4-7 18:00
|
|

This Chart Says Bitcoin Is A Leading Indicator For Inflation
A new price chart comparing Bitcoin (BTCUSD) with the US Consumer Price Index (CPI) could suggest that BTC is a leading indicator for inflation. And if what the chart signals is accurate, inflation could be coming back in a major way. дальше »
2023-3-30 02:09
|
|
Shares of Grayscale Bitcoin Trust Form Bullish Chart Pattern: Technical Analyst
The bullish reversal pattern would open doors for a 50% price rally, chart analysts said. дальше »
2023-3-9 15:36
|
|
Top 5 Crypto Chart Patterns: Best Examples
Technical analysis is a system used by traders to make trading decisions. It involves analyzing past market data to identify patterns and trends that may indicate future price movements. One of the key tools used in technical analysis is a chart, which provides a graphical representation of price movements over time. дальше »
2023-2-17 22:00
|
|
What To Expect As Bitcoin Pictures Bullish Divergence On Chart?
The Bitcoin price has been making a slight recovery on its chart. Although the coin has been consolidating over the past few weeks, BTC has been attempting to make an upward movement. Over the last 24 hours, the coin has registered a 0. дальше »
2023-1-7 18:06
|
|
Bitcoin Developing “Three Blind Mice” Trading Pattern, Peter Brandt Says. Here’s What It Means
Commodity trader Peter Brandt has posted a mysterious chart pattern, and no one is seemingly capable of deciphering it дальше »
2022-12-17 21:11
|
|
XRP Price Demonstrates Bullish Behavior, Here's What Else Chart Hides
XRP chart shows big bullish potential as this emerging pattern once led to 4,400% spike дальше »
2022-11-20 17:43
|
|
6 Chart Patterns That You Should Know About
There's little doubt that any profitable cryptocurrency trader will always have a set of 'go to' chart signals they look to when making trading decisions. In this article we profile six of the most important chart patterns that smart traders are watching for. дальше »
2022-10-7 14:00
|
|
Polkadot Price Drops On Chart With Resistance At $6.80, What’s Next?
Polkadot price had touched the $8 price level before the bulls lost steam and fell on the one-day chart. DOT travelled 3. 6% lower in the last 24 hours on its chart. Over the past week, DOT had gained some value, but most of that was nullified at press time. дальше »
2022-9-28 07:00
|
|

Ethereum domain names top Bored Apes on OpenSea’s weekly chart
Ahead of the upcoming Merge, ENS domains have reached the top of OpenSea’s seven-day chart in trading volume.
дальше »2022-9-7 08:25
|
|
Dogecoin Retraced On Its Chart, Is There Chance Of An Uptrend?
Dogecoin slightly receded on its chart after displaying bullish momentum. Today most of the market movers were seen in the red. Currently, DOGE has found support near the $0. 06 region, a while back the meme-coin had traded a little above the $0. дальше »
2022-7-22 04:00
|
|
Stellar (XLM) Broke Down From The Descending Triangle, Fresh Lows On Chart?
Stellar (XLM) picked up pace on the daily chart as the coin registered some upward movement. The coin has been trading within a descending channel. Although the coin was moving sideways, if bulls reclaim the chart XLM can break above the channel. дальше »
2022-7-16 07:00
|
|
Litecoin Rejected At $55, Bears Might Drag LTC Below Immediate Support Line
Litecoin attempted to rise on its chart, however, the bears were still strong on the chart. Although the coin showed some recovery, technical outlook pointed towards further decline. Bitcoin too has lost steam as the coin plunged below the $20,000 mark. дальше »
2022-7-14 04:00
|
|
Axie Infinity [AXS] advances on the price chart but could the bears have laid down a trap?
Disclaimer: The information presented does not constitute financial, investment, trading, or other types of advice and is solely the opinion of the writer. On a higher timeframe chart, Axie InfinitThe post Axie Infinity [AXS] advances on the price chart but could the bears have laid down a trap? appeared first on AMBCrypto. дальше »
2022-7-10 20:00
|
|
Ethereum RSI Indicator Shows First Bullish Signal Since Market Sell-Off, Aiming at Reversal from $1,090
Ether is showing first signs of reversal as divergence appears on intraday chart дальше »
2022-6-15 13:18
|
|

Elon Musk’s Intended ‘Improvements’ For Cryptos After Buying Twitter
The world’s richest man as per Forbes has acquired social media giant Twitter and promised ‘significant improvements’ to the microblogging site in a couple of months. The move could chart a new course for his and the crypto-conversation without necessarily changing how Twitter operates. дальше »
2022-5-3 13:38
|
|