2020-7-30 06:58 |
Bitcoin is struggling to stay above the $11,200 resistance level against the US Dollar. BTC is currently correcting lower and it could continue to move down towards $10,700.
Bitcoin is slowly moving lower after forming an intraday high near the $11,349 level. A couple of back-to-back candles suggest that the price might continue lower towards $10,700. There was a break below a key bullish trend line with support near $11,150 on the hourly chart of the BTC/USD pair (data feed from Kraken). The pair must stay above the $10,700 support level to start a fresh increase in the near term. Bitcoin Price Struggling To Clear $11,400Bitcoin price made another attempt to surpass the $11,400 resistance against the US Dollar, but it failed. BTC failed to stay above the $11,200 level and formed an intraday high near the $11,349 level.
It is currently correcting lower below $11,200, but it is well above the 100 hourly simple moving average. During the recent decline, there was a break below a key bullish trend line with support near $11,150 on the hourly chart of the BTC/USD pair.
The pair is now approaching the $10,950 support. It is close to the 50% Fib retracement level of the upward wave from $10,581 swing low to $11,349 high. The first major support is near the $10,850 level.
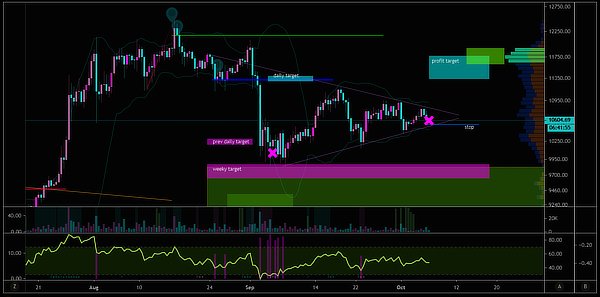
Bitcoin price trades below $11,200. Source: TradingView.comThe next major support is near the $10,700 level (a multi-touch zone). An intermediate support might be the 76.4% Fib retracement level of the upward wave from $10,581 swing low to $11,349 high at $10,760.
If the bulls fail to protect the $10,700 support level, the price could test the 100 hourly simple moving average. Any further losses may perhaps lead the price towards the main $10,300 support zone.
Dips in BTC Present Buying Opportunity?Clearly, bitcoin is showing early signs of struggle near the $11,200 and $11,400 levels. Having said that, the current formation could be just a consolidation phase above $10,700 and $10,300.
As long as the price is trading above the $10,700 and $10,300 support levels, it is likely to resume its upward move. Any further losses may probably start an extended downside correction and the price could even dive below the $10,000 support.
Technical indicators:
Hourly MACD – The MACD is currently gaining pace in the bearish zone.
Hourly RSI (Relative Strength Index) – The RSI for BTC/USD is now below the 50 level, with bearish signs.
Major Support Levels – $10,850, followed by $10,700.
Major Resistance Levels – $11,200, $11,400 and $11,500.
origin »Bitcoin price in Telegram @btc_price_every_hour
Bitcoin (BTC) на Currencies.ru
|
|