2023-5-25 21:03 |
On-chain data shows the Bitcoin sell-side risk ratio has approached all-time lows recently, a sign that a big move could be coming for the coin.
Bitcoin Sell-Side Risk Ratio Has Observed A Plunge RecentlyAs pointed out by the lead on-chain analyst at Glassnode in a Tweet, BTC sellers may have become exhausted recently. The “sell-side risk ratio” is an indicator that measures the ratio between the sum of all profits and losses being realized in the Bitcoin market and the realized cap.
The “realized cap” here refers to the capitalization model for Bitcoin that calculates a sort of “true” value for the cryptocurrency by assuming that each coin in the supply is not worth the same as the current spot price, but the price at which it was last moved.
As the profits and losses being harvested in the market are nothing but a measure of the selling pressure in the market, this indicator tells us how the selling pressure (or the sell-side risk) looks like relative to the value of the cryptocurrency (the realized cap).
When the value of this indicator is high, it means the investors are participating in a high amount of profit/loss realization right now. Such a market is usually high risk, as the price tends to be more volatile during periods with these values.
On the other hand, low values imply the holders are reluctant to sell currently. These conditions generally occur when the market has calmed down and accumulation tends to take place in such periods.
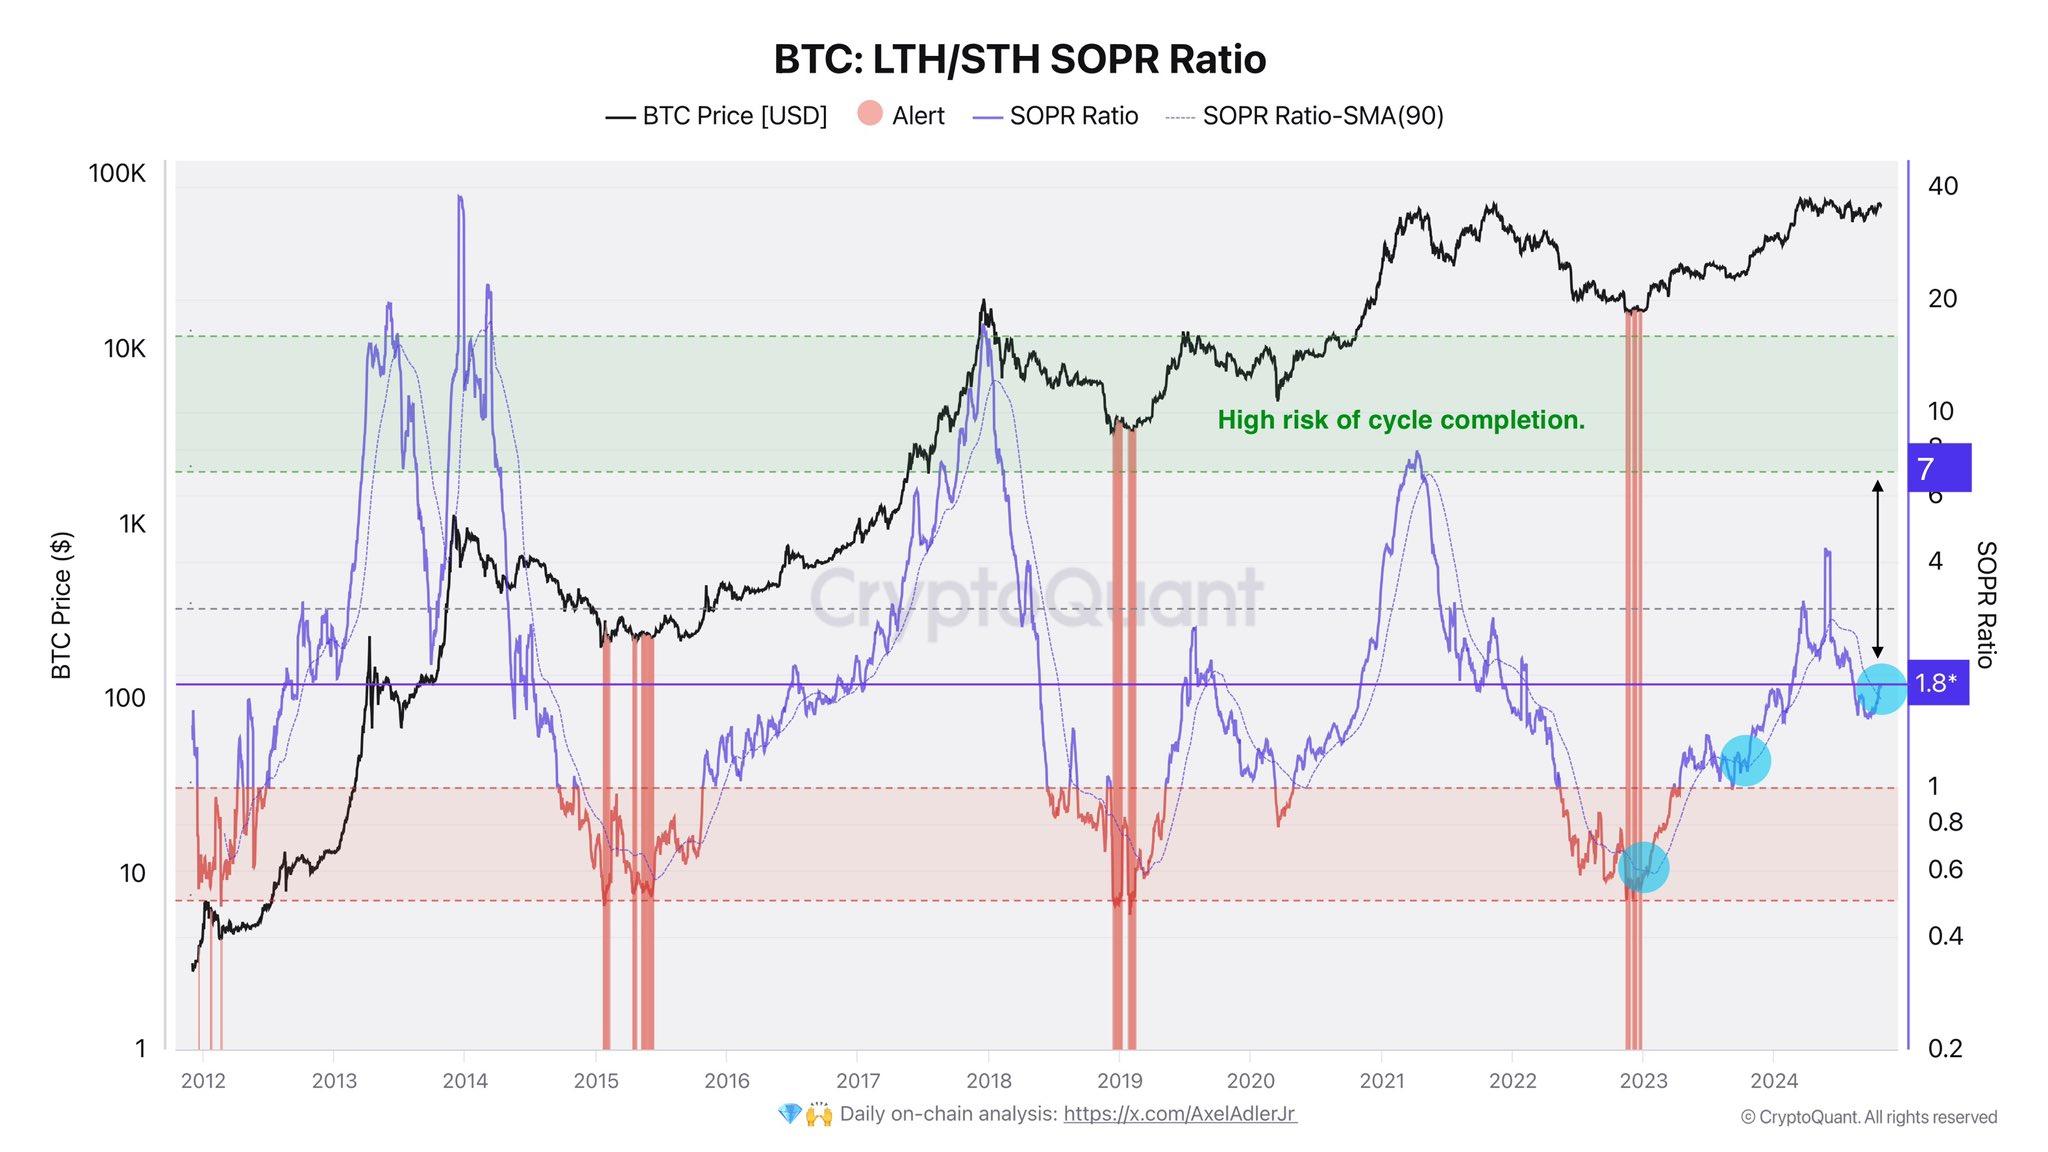
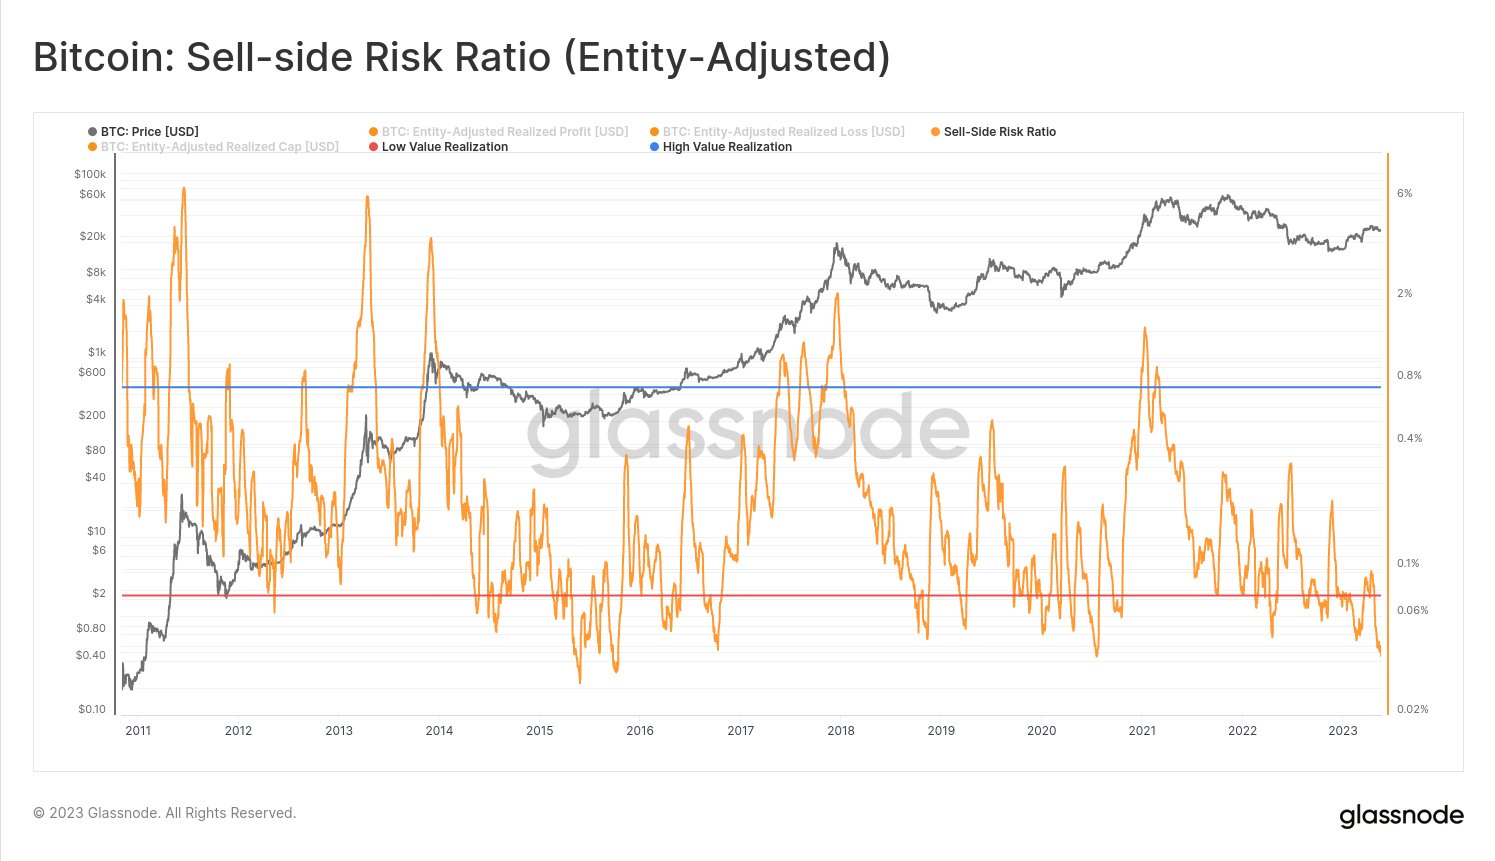
Now, here is a chart that shows the trend in the Bitcoin sell-side risk ratio over the history of the cryptocurrency:
As shown in the above graph, the Bitcoin sell-side risk ratio has seen a sharp plunge recently, a sign that there is little profit or loss realization going in the market right now.
The indicator is now below the “low value realization” line that the analytics firm has defined (colored in red in the chart). Historically, whenever the metric has plunged into this zone, the market has built up towards a sizeable move in the price.
Since such low values of the indicator imply the lack of sellers in the market, the common expectation may be that this can be a bullish sign. However, as is visible from the graph, this hasn’t necessarily been the case.
Both bullish and bearish price action has occurred following the formation of this pattern. Just back in March of this year, the indicator had shown this trend, but the cryptocurrency had followed up with a sharp correction.
Breaks into the high value realization zone (that is, the condition where there is a large amount of selling going on), though, have generally always been bearish for Bitcoin.
As the indicator has once again dipped into the low value realization area, it’s possible that a large move in the price may follow soon. Although it’s uncertain which direction exactly this volatility might go.
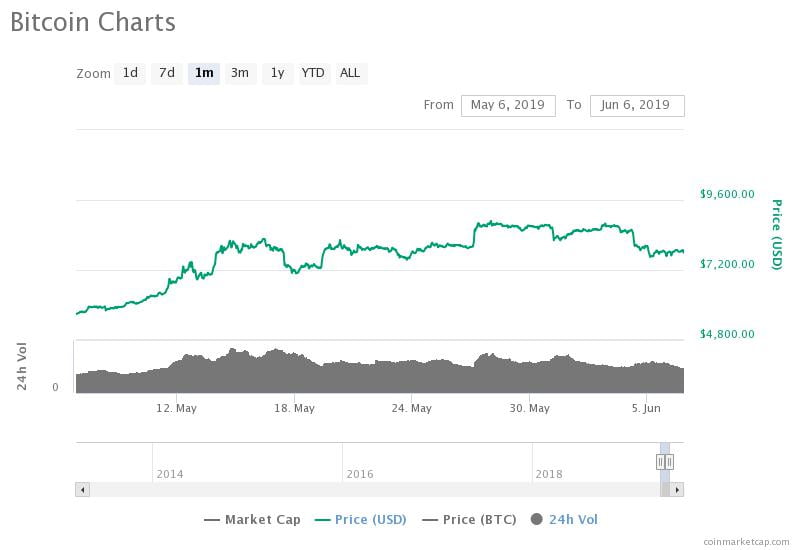
BTC PriceAt the time of writing, Bitcoin is trading around $26,100, down 2% in the last week.
origin »Bitcoin price in Telegram @btc_price_every_hour
Bitcoin (BTC) на Currencies.ru
|
|