Bitcoin Is Struggling To Hold Its 200-Day MA

Bitcoin Is Struggling To Hold Its 200-Day MA
фото показано с : bitcoinmagazine.com

2021-12-30 00:15

Despite the traditional stock market view on 200-day moving averages, a dip below it could mean a sale event for Bitcoin.

Bitcoin has been trading at sideways price action for most of December, struggling to stay above the 200-day moving average.

After a strong October and an early November of new all-time highs, Bitcoin has encountered a blocking road in December, having lost 13.60% since the beginning of the month. This reality stands in stark contrast to a widespread belief that Bitcoin’s price would hit $100,000 by the end of the year.

At the time of writing, Bitcoin is trading at around $47,500 after having closed below its 200-day moving average on Tuesday. The 200-day MA is often used to gauge an asset’s long-term trend in traditional capital markets. An asset is generally considered to be in an overall uptrend for as long as it holds above its 200-day MA.

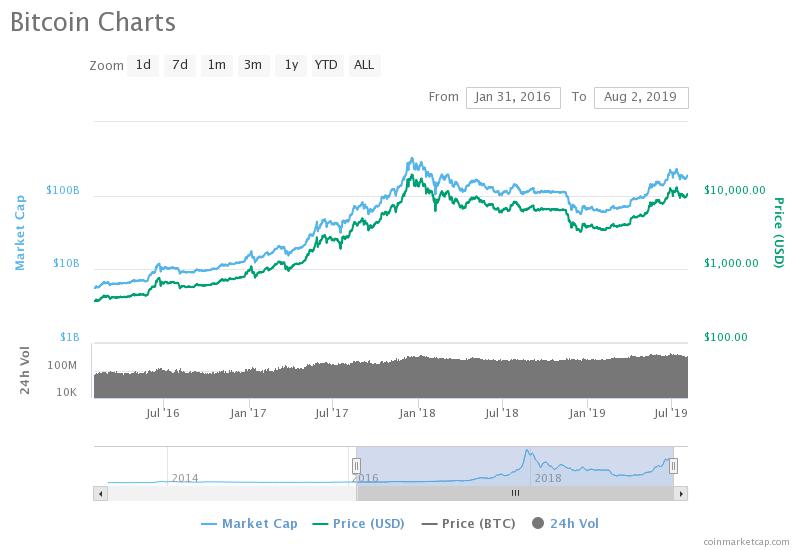
Bitcoin closed below its 200-day moving average yesterday. Source: TradingView.

In March 2020, Bitcoin violently broke below its 200-day MA as the pandemic outbreak spread fear throughout the world, including capital markets. It took BTC about two months to get back above the moving average, triggering a stellar bull market that would extend past the end of the year. Bitcoin held above its 200-day MA for over a year until China banned bitcoin mining, once again spreading fear to those unaware of Bitcoin’s actual functioning mechanics and triggering a short winter for price over the summer months.

Bitcoin rose from $8,000 to $60,000 in less than one year before correcting below its 200-day MA at around $40,000 in May 2021. Source: TradingView.

Despite the traditional stock market view that an asset below its 200-day MA could be in a bear market, for Bitcoin, it could represent a sale event. Given the peer-to-peer (P2P) currency’s strong, unique fundamentals and its history of crushing all other assets over the past 10 years, a dip below a technical indicator can serve as a discount indication, especially given Bitcoin’s volatility, which makes it plunge and soar more rapidly than traditional assets.

Similar to Notcoin - Blum - Airdrops In 2024

origin »

Bitcoin (BTC) на Currencies.ru

$ 67676.88 (-0.11%)
Объем 24H $19.988b
Изменеия 24h: -0.27 %, 7d: -1.96 %
Cегодня L: $67187.68 - H: $67762.57
Капитализация $1333.67b Rank 1
Цена в час новости $ 46688.03 (44.96%)

bitcoin 200-day dip averages moving below sale

bitcoin 200-day → Результатов: 110


Фото:

Bitcoin Could Soon Break its 200-Day MA, Triggering Next Uptrend

Bitcoin has been able to once again push into the upper-$7,000 region after facing multiple rejections here throughout the past few days The cryptocurrency is pushing up against its 200-day moving average – a key trend-determining level A break above this 200-day MA could spark a major upside movement, with some analysts thinking this is imminent After facing multiple harsh rejections within the upper-$7,000 region throughout the past couple of days, Bitcoin has been able […]

2020-4-28 21:00


This weird Bitcoin pattern suggests Wednesday’s 10% dump may precede a massive surge

Over the past few days, all anyone could talk about on Crypto Twitter was the golden cross that had formed on Bitcoin’s one-day chart. For those unaware, a traditional golden cross in technical analysis is when an asset’s 50-day simple moving average crosses above its 200-day moving average, suggesting that a decisive bull trend is […] The post This weird Bitcoin pattern suggests Wednesday’s 10% dump may precede a massive surge appeared first on CryptoSlate.

2020-2-20 12:00


Bitcoin Back in a Bull Market, Trend Says Price Would Jump Above $17,500: Tom Lee

After becoming the best performing and the hottest asset of the decade, Bitcoin is up over 26% YTD and staying above $9,000 level. The world’s leading cryptocurrency is currently trading above its 200-day moving average which according to Bitcoin bull Tom Lee, the founder of independent research and advisory firm Fundstrat is a significant signal […]

2020-2-5 16:47


Top Analyst Who Called Bitcoin’s Rally to $9,500 Warns a “Hard Dump” May Happen

If you told investors in mid-January that Bitcoin would soon surmount $9,000, they might’ve thought you were crazy. At the time, the cryptocurrency had just been rejected multiple times from key resistances in the high-$8,000s — namely the ever-so-important 200-day moving average (seen as a “make or break” level) and the horizontal right around $9,000... The post appeared first on NewsBTC.

2020-2-5 14:00


Money Is At Risk In Banks, Bitcoin Is Probably The Most Secure Currency Right Now: Tim Draper

Bitcoin price has come down to $8,300 level from last week’s $9,200 level. Despite bouncing off the support yesterday, it was unable to reclaim the level and made its way back toward support. We have come to some serious resistance at the 200-day moving average, a line that Mati Greenspan, founder of Quantum Economics says […]

2020-1-26 19:20


Analyst: this dire technical formation may spell doom for Bitcoin’s near-term price action

The 2020 Bitcoin rally was fun while it lasted, but the cryptocurrency recently formed a much-dreaded technical formation that may signal that BTC will see further near-term downside. This technical formation – which is accurately described by analysts as a “death cross” – comes about after an asset’s 50-day moving average crosses beneath its 200-day […] The post Analyst: this dire technical formation may spell doom for Bitcoin’s near-term price action appeared first on CryptoSlate.

2020-1-24 22:19


Фото:

Key indicator shows its good time to accumulate as Bitcoin price touches $7800

As the Bitcoin price surpassed $7,500 on Nov. 27th, a key long term trend indicator showed that it is still a good period to accumulate BTC. Since the Ecoinometrics team released its latest “Daily Bitcoin Mayer Multiple Report” citing the Mayer multiple, a ratio of the Bitcoin price to 200-day moving average, the Bitcoin price […] The post Key indicator shows its good time to accumulate as Bitcoin price touches $7800 appeared first on CryptoSlate.

2019-11-29 17:57


Фото:

For the Bitcoin Price to Reach $9200, the 200-Day Moving Average Must Be Breached

Moving averages (MA) are often very significant in determining future price movements. The price of an asset, like Bitcoin, often reacts to its MAs — either using them for support or resistance. The higher the number of times an asset reacts to an MA, the higher its significance — thus, the more likely it is […] The post For the Bitcoin Price to Reach $9200, the 200-Day Moving Average Must Be Breached appeared first on BeInCrypto.

2019-10-10 17:29


Bitcoin Price Breaks Below $8,000 Just Days After Triangle Breakdown

Bitcoin price is currently below $8,000 just days after breaking down from a multi-month triangle pattern where it was consolidating. With Bitcoin now trading below $8,000, where could the leading crypto asset by market cap go next for targets? Bitcoin Price Trades Below $8,000, Breaking Through 200-Day Moving Average Bitcoin price is currently free-falling, trying.

2019-9-26 19:13


Bitcoin Cash Price Analysis BCH / USD: Rallying Cry

Bitcoin Cash has a bullish short-term bias, with the BCH / USD pair recovering above its 200-period moving average on the four-hour time frame The four-hour time frame shows the presence of a bullish ascending triangle pattern The daily time frame highlights that the BCH / USD pair is still trading above its key 200-day […] The post Bitcoin Cash Price Analysis BCH / USD: Rallying Cry appeared first on Crypto Briefing.

2019-8-12 16:19