2020-10-15 02:33 |
Bitcoin has seen a strong rally over the past few days after weeks of consolidation. The leading cryptocurrency has gained around $1,000 from last week’s lows near $10,400.
This rally has allowed the technical case for further upside to continue to build. One crypto-asset analyst recently noted that Bitcoin is about to form a pivotal buying signal that was last seen in late July, in the midst of the strong uptrend that took the asset as high as $12,500. Should history repeat, Bitcoin should continue to ascend in the days and weeks ahead.
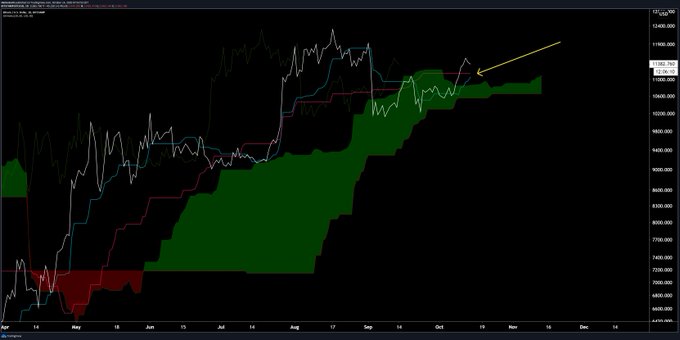
Related Reading: Here’s Why Ethereum’s DeFi Market May Be Near A Bottom Bitcoin Ichimoku Cloud Shows Reasons to Be BullishJosh Olszewicz, a crypto-asset analyst, recently shared the chart below. It shows that the cryptocurrency’s one-day Ichimoku Cloud is about to see a TK Cross, when the line in blue crosses above the line in red. The Ichimoku Cloud is a popular technical indicator that shows crucial technical levels and the overall market trend.
The last time this bullish signal was seen for Bitcoin was in late July, amid the vertical surge from the $9,000s to $11,000. BTC continued to rally after this signal formed, suggesting the cryptocurrency will do so now.
The signal may not confirm for a few more days, depending on how the price action transpires in the days ahead for Bitcoin.
Chart of BTC's price action since the start of April with an Ichimoku Cloud analysis by crypto trader Josh Olszewicz (@Carpenoctum on Twitter). Source: BTCUSD from TradingView.com Related Reading: Tyler Winklevoss: A “Tsunami” of Capital Is Coming For Bitcoin Short-Term Outlook WeakWhile Bitcoin is facing down a crucial buy signal, the short-term outlook is weak.
One crypto-asset trader recently shared the chart below. The chart suggests that there is quite a confluence of trends that show a market pullback in the price of Bitcoin will transpire in the coming days.
The chart shows that Bitcoin has formed a “Sell 9” candle just recently as per the Tom Demark Sequential, indicating an imminent bearish reversal. The same crypto-asset trader added that Bitcoin has formed key bearish divergences on its four-hour chart. The divergence has formed between the Bitcoin price and the four-hour RSI and MACD.
Chart of BTC's price action since the end of August with analysis by crypto trader CryptoHamster (@Cryptohamsterio on Twitter). Source: BTCUSD from TradingView.com Related Reading: 3 BTC On-Chain Trends Show a Macro Bull Market Is Brewing Featured Image from Shutterstock Price tags: xbtusd, btcusd, btcusdt Charts from TradingView.com Bitcoin is About to Form a Pivotal Buy Signal Last Seen in Late July origin »Bitcoin price in Telegram @btc_price_every_hour
Rally (RALLY) на Currencies.ru
|
|


