Bitcoin Dominance Rate (BTCD) Falls Back Near Yearly Lows

Bitcoin Dominance Rate (BTCD) Falls Back Near Yearly Lows
фото показано с : beincrypto.com

2021-12-15 09:33

The Bitcoin dominance rate (BTCD) was very close to reaching a new yearly low but it has bounced back some in the short term

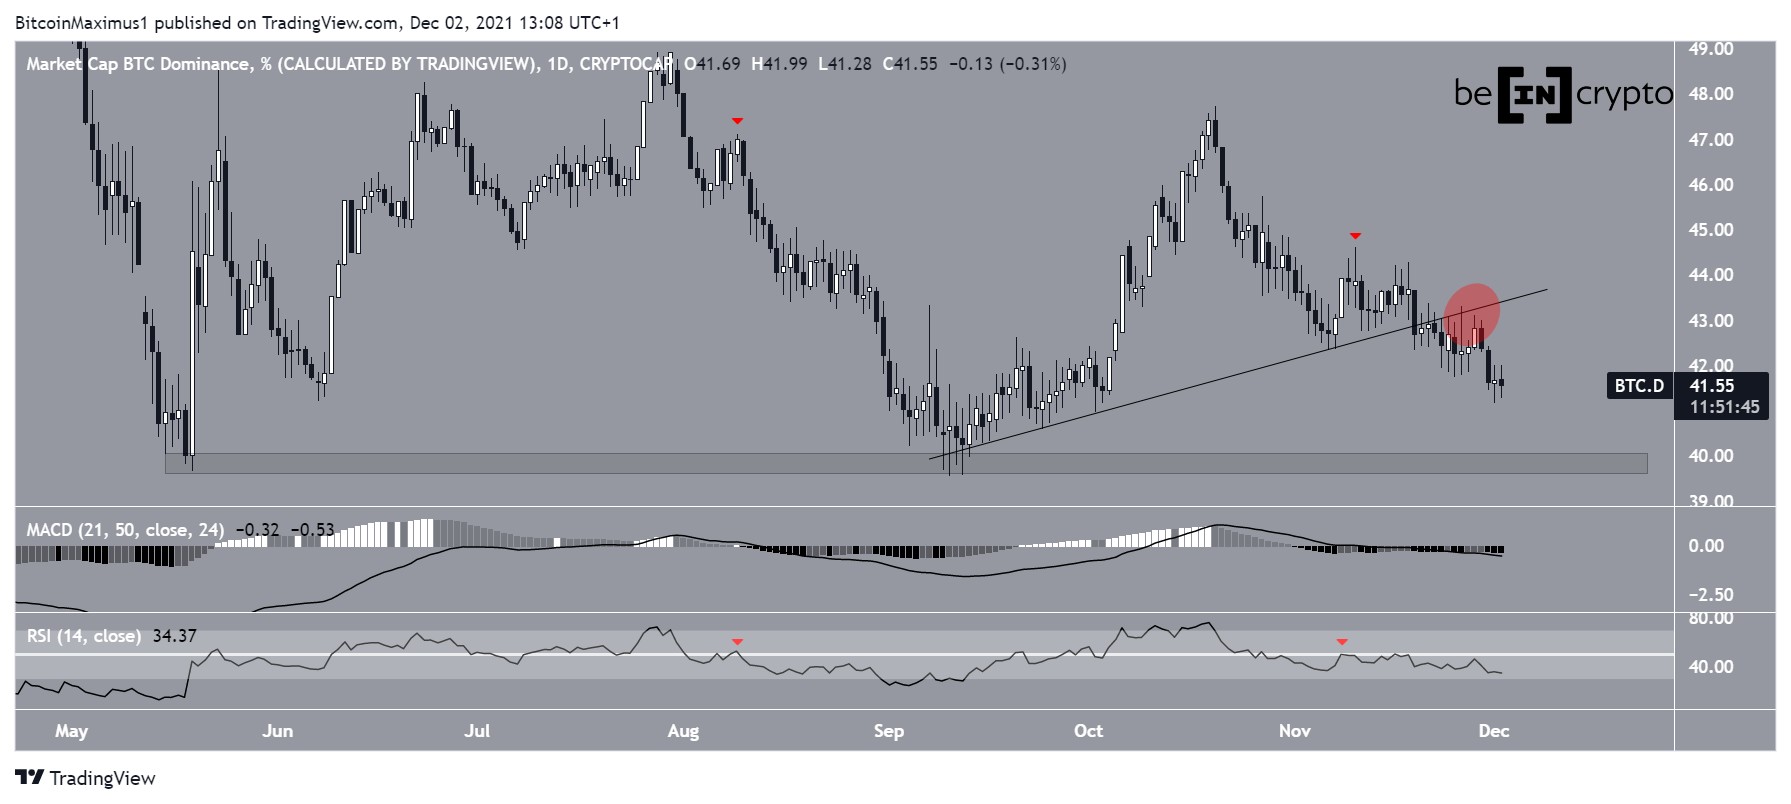
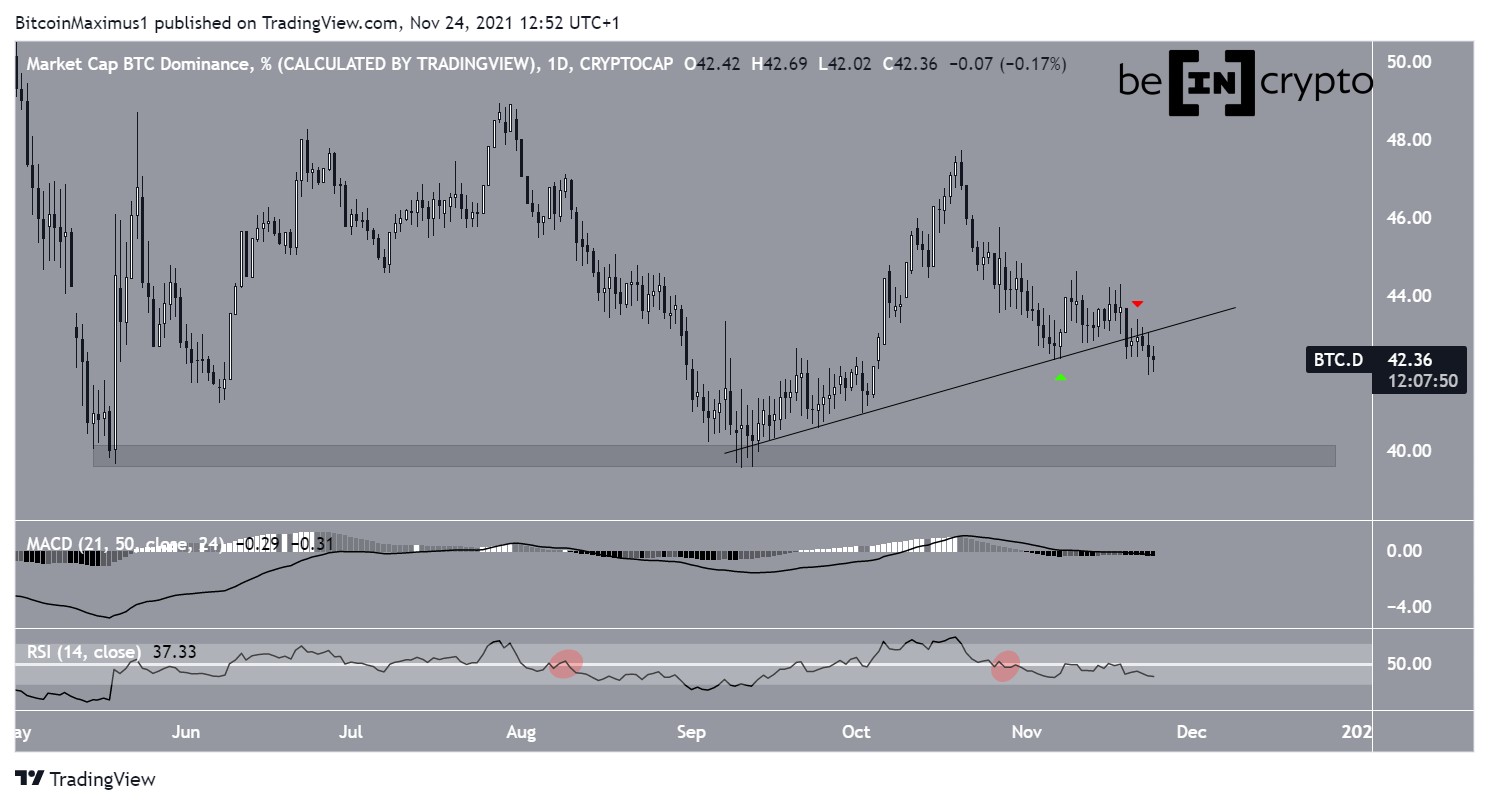
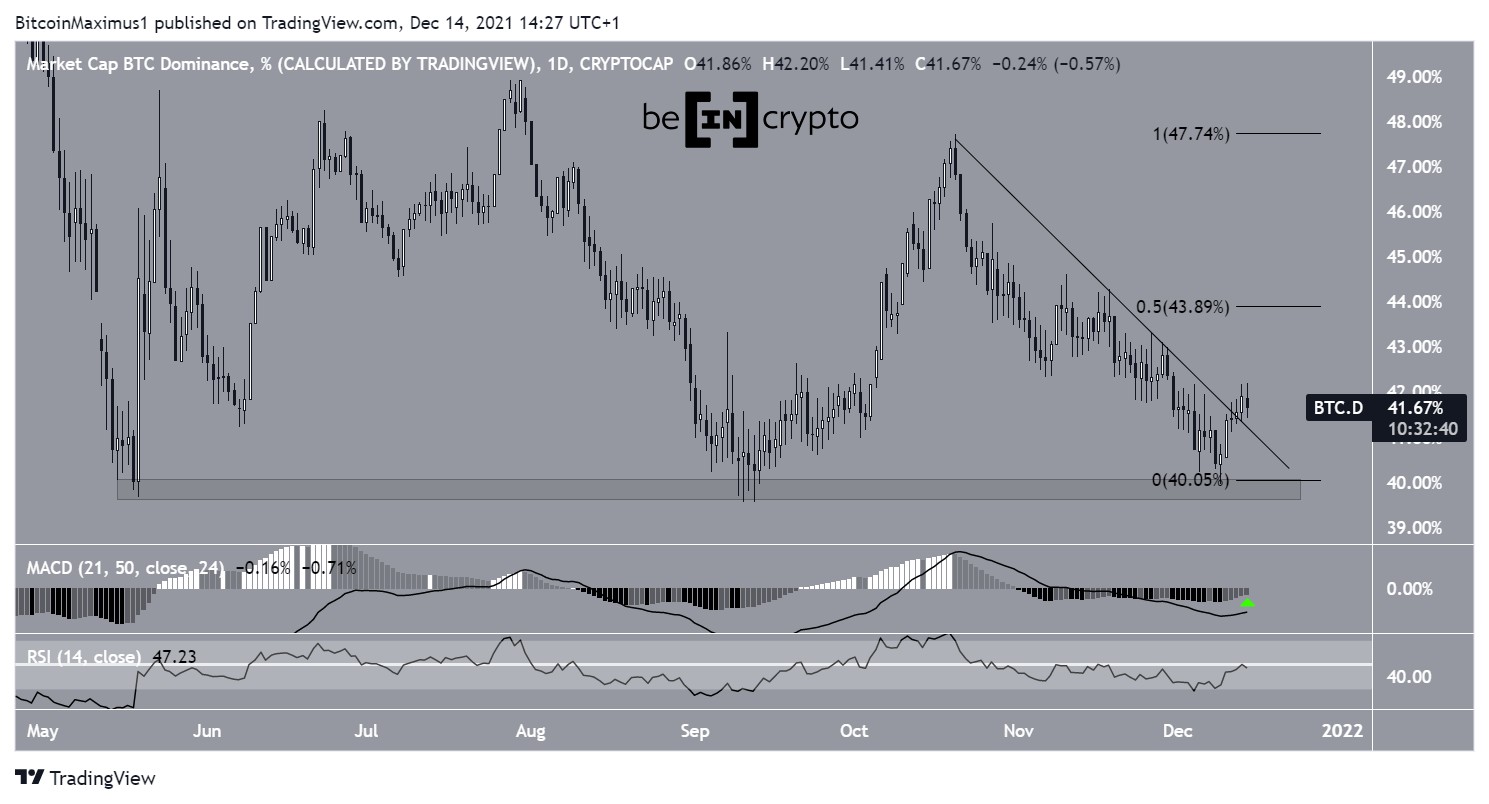
The Bitcoin dominance rate has been decreasing since Oct 20 after reaching a high of 47.72%. Throughout the descent, it followed a descending resistance line. This led to a low of 39.95% on Dec 9. The low was made very close to the long-term 39.50% support area. 

The dominance rate bounced back after and proceeded to break out from the descending resistance line on Dec 12. If it continues to increase, the main resistance area would be found at 44%. This target is both the 0.5 Fib retracement resistance level and a horizontal resistance area.

Technical indicators are starting to show bullish signs. The MACD is moving upwards and is nearly positive. The MACD is created by short and long-term moving averages (MA), and this is a sign that the short-term MA is gaining speed relative to the long-term average. 

Similarly, the RSI is moving upwards and is at the 50-line. Readings above this line are normally considered signs of a bullish trend.

BTCD Chart By TradingView

Cryptocurrency trader @TradingTank stated that the on-balance volume (OBV) indicator, which measures volume changes, is showing a bottom on BTCD. While this has yet to be confirmed, the MACD and RSI are also showing signs of a potential bottom.

Source: Twitter Long-term BTCD movement

Despite the ongoing bounce in the daily time frame, the weekly chart still paints a bearish picture.

The weekly RSI has generated a hidden bearish divergence (red line). This same pattern preceded the massive fall to the 40% range. Furthermore, the indicator is still below 50 and the MACD is still negative.

The downward move that began in December 2020 looks like it has four completed waves. As a result, another leg to the downside would be likely to complete the fifth and final wave.

The readings from the weekly time frame suggest that any bounce is likely to be short-lived, and the downward movement is expected to continue in the long term.

BTCD Chart By TradingView

For BeInCrypto’s latest Bitcoin (BTC) analysis, click here

The post Bitcoin Dominance Rate (BTCD) Falls Back Near Yearly Lows appeared first on BeInCrypto.

origin »

Bitcoin price in Telegram @btc_price_every_hour

BitcoinDark (BTCD) на Currencies.ru

$ 16.23 (+0.00%)
Объем 24H $0
Изменеия 24h: 0.00 %, 7d: 0.68 %
Cегодня L: $16.23 - H: $16.23
Капитализация $20.923m Rank 99999
Доступно / Всего 1.289m BTCD

yearly bitcoin back dominance rate btcd falls

yearly bitcoin → Результатов: 126


Bitcoin Recording Third Best Quarterly Close & Another Strong Q2, But Q3 Paints a ‘Challenging’ Picture

Bitcoin is currently trading above $9,100 in green with just $1.1 billion in ‘real’ trading volume. The leading digital currency has recovered 140% since the March crash but is up only 27% YTD. Despite the minimal yearly gains and ending the first quarter of 2020 on a red note of 10.58%, the second quarter has […]

2020-7-1 19:15


Фото:

Here’s What Comes Next After Bitcoin Closed Above Yearly Resistance at $9,500

Bitcoin’s buyers and sellers engaged in a heated battle yesterday just prior to the cryptocurrency’s critical monthly close This led it to see heightened volatility, with bulls prevailing over bears Buyers were able to propel the cryptocurrency above a massive monthly resistance level that has been holding strong throughout part of 2019 and all of 2020 The close above this level could be a bullish catalyst Bitcoin has been seeing some turbulence as it consolidates […]

2020-6-1 21:00


Фото:

This Technical Pattern Signals Bitcoin is About to Explode to $12,000

Bitcoin saw a sharp overnight rebound that allowed it to reclaim its position within the mid-$9,000 region This came about after a period of weakness as it traded within the lower $9,000 region It now appears that the crypto’s recent volatility has allowed it to form an incredibly bullish technical formation If it posts a breakout of this formation, the crypto could soon be trading at fresh yearly highs of around $12,000 Bitcoin and the […]

2020-5-31 19:00


Фото:

Ethereum’s Macro Price Structure is Flashing Warning Signs; Things to Consider

The bear-favoring volatility seen by the aggregated crypto market yesterday has once again caused Ethereum to decline beneath the $200 price level The cryptocurrency is now flashing signs of growing weakness as multiple moving averages begin invalidating all of ETH’s macro bullishness One analyst believes that this present technical weakness could lead ETH to move back towards its yearly open Ethereum saw a sharp decline yesterday alongside Bitcoin and the aggregated crypto market. After tapping […]

2020-5-16 23:00


Фото:

Bitcoin Could Push to Fresh Yearly Highs if Buyers Defend One Key Level

Following an extended period of consolidation within the upper-$8,000 region, Bitcoin has finally garnered enough momentum to surmount its resistance at $9,200 This movement has opened the gates for significantly further upside, as it took out a major liquidity region and has yet to face any type of harsh rejection One analyst is explaining that a continued defense of $9,200 is all that BTC now needs to make a bid at the $10,000 region Bitcoin’s […]

2020-5-7 21:00