2020-6-25 08:15 |
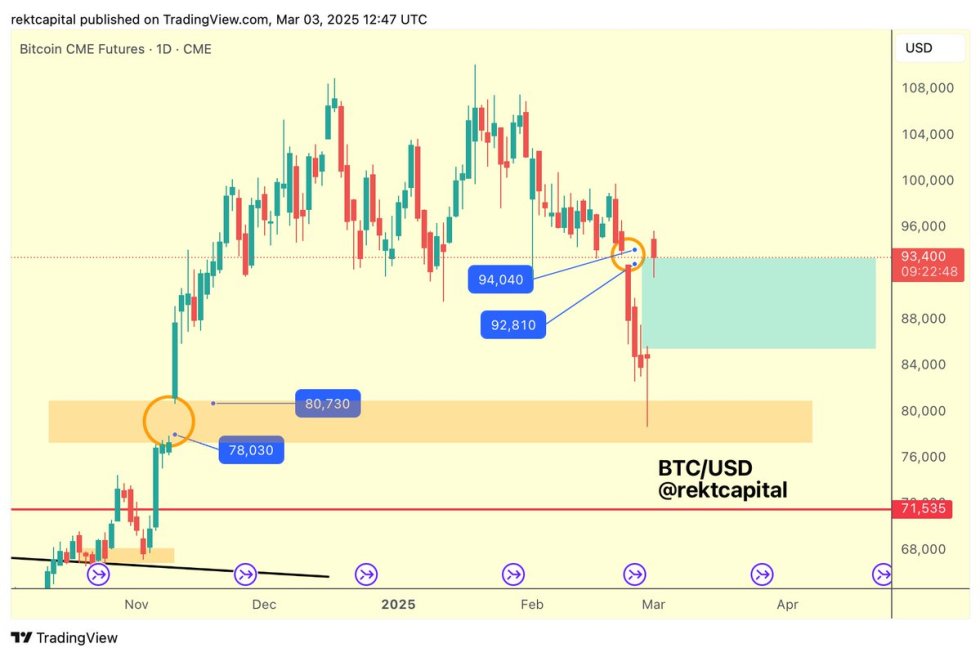
Bitcoin is trading inside a tight range with its 10-day realized volatility dropping to a year-to-date low of 30 percent. Several analysts point to a lackluster sentiment in the market as Bitcoin repeatedly fails to continue its uptrend beyond $10,000. A period of low volatility mostly ends up in a price breakout in either direction. Macro fundamentals align in favor of bulls. Bitcoin has been trading sideways in a tight price range since the beginning of May 2020. As a result, its 10-day volatility has now fallen to a new year-to-date low. According to data provided by Skew, an on-chain analysis platform, the so-called BTCUSD realized volatility this week dipped to 30 percent. Also, the 30-day volatility declined to 57 percent, a pre-crash level. The chart below shows these developments precisely. Bitcoin Plunge The Bitcoin price is fluctuating inside a trading range of $9,000 and $10,000 now for more than a month, data on TradingView.com shows. Looking at the tightened price moves through Bollinger Bands further implies a growing contraction in the cryptocurrency’s volatility. Bitcoin price chart on TradingView.com showing its contracting Bollinger Bands. Source: TradingView.com Readings on the Bollinger Bands Width, which represents current price volatility in numerically, is now near 0.08, its lowest since April 1. Observers see it as a sign of growing stress in the bitcoin market. Traders have switched their sentiment from adventurous to cautious. “Extreme volatility compression is still active on Bitcoin, which means that the recent pump has to be treated with extreme suspicion,” said one analyst. “The price can explode to the downside at any moment until Bitcoin has surpassed $9,800+ again.” Meanwhile, recent signals show the cryptocurrency attempting to come out of its slumber. The BTCUSD exchanger rate on Wednesday dived by more than 3 percent, or circa $500, to below $9,000. So it seems, the move was an attempt to maintain Bitcoin’s erratic correlation with the S&P 500. The U.S. benchmark index fell 2.5 percent, as well. The big move did not improve the volatility but rose speculation about an imminent breakout. To Rising or Not A period of low volatility ends up in a breakout. But it is difficult to predict the direction of Bitcoin’s next big move. As shown in the chart above, Bitcoin is trading inside a symmetrical triangle, its price fluctuating within the pattern’s contracting upper and lower trendlines. Since the Triangle appears after Bitcoin’s 150 percent price rally, its bias is to the upside. That puts Bitcoin en route to new 2020 highs. Bitcoin price chart on TradingView.com showing its short-term trade setup. Source: TradingView.com Meanwhile, the cryptocurrency is consolidating in the lower half of the Bollinger Band range. That could push it lower towards its next technical support targets near $8,600 and $8,000. Meanwhile, macroeconomic sentiments, such as prospects of a slow economic recovery amid the resurgence of infections, could swell Bitcoin’s downside sentiment. History favors Bitcoin. An extended period of low volatility typically drives the cryptocurrency higher. For instance, as BBW hit 0.08 on April 1, 2019, it followed a major spike in the price the very next day. Eventually, BTCUSD rose by more than 220 percent in the next four months. origin »
Bitcoin price in Telegram @btc_price_every_hour
Bitcoin (BTC) на Currencies.ru
|
|