2020-11-13 09:30 |
On Nov 5, the Bitcoin Dominance Rate (BTCD) was rejected by a descending resistance line that has been in place for more than a year.
The rate is expected to decrease in the short-term before eventually making another attempt at breaking out.
Bitcoin Dominance Rejected from ResistanceThe BTCD rate has been increasing since the beginning of September. The increase continued until reaching a descending resistance line that has been in since July 2019. BTCD reached this line on Nov 5, but was rejected shortly afterward and began the current decrease.
The line also coincides with the 66.5% resistance area which is the 0.786 Fib level of the most recent decrease. The closest support is found at 64.5%.
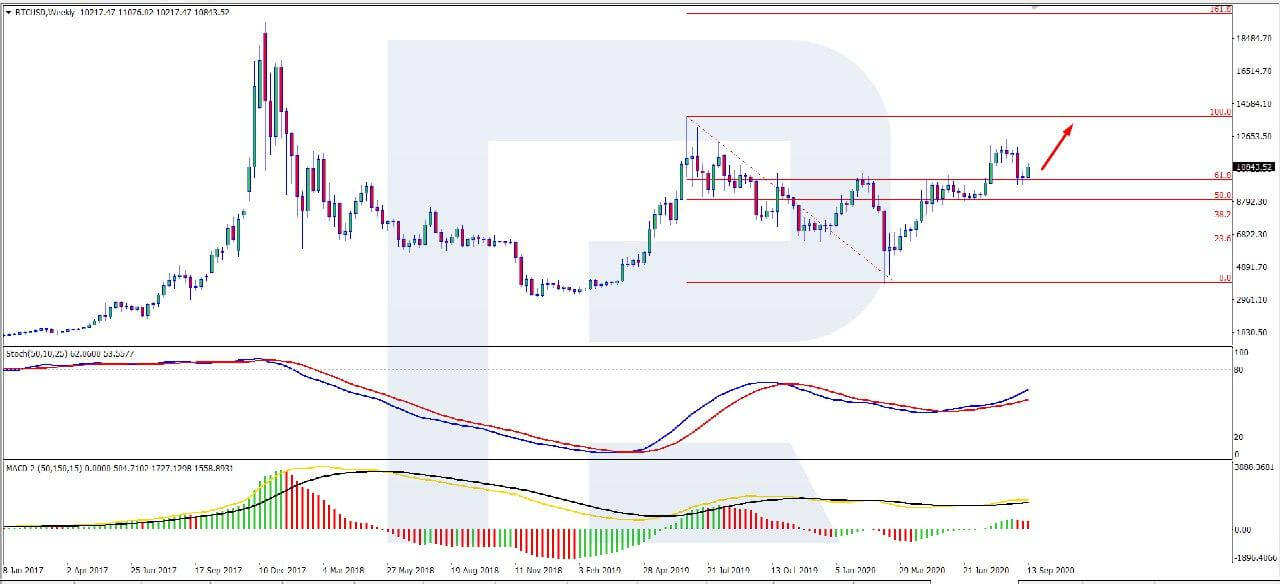
BTCD Chart By TradingView Short-Term BTCD MovementTechnical indicators do not give a clear verdict on the future movement. While the MACD is overbought and the histogram is showing weakness, it has not yet begun to decrease nor has it generated bearish divergence.
Similarly, the RSI has begun to decrease, falling down from the overbought region, but has not generated any bearish divergence.
Finally, the Stochastic oscillator has yet to make a bearish cross, even though it is moving downwards.
Since the price is approaching the resistance line once more, and technical indicators do not show strength, another rejection would be the most likely scenario.
BTCD Chart By TradingViewThe shorter-term chart provides a similar outlook. The rate is trading between the 0.5-0.618 Fib levels of the most recent decrease, a common level for a retracement to end.
However, neither the MACD nor RSI has generated any bearish divergence, though the latter is overbought.
BTCD Chart By TradingView Wave CountCryptocurrency trader @TheEWguy outlined a BTCD chart, stating that after a relief rally, an extended downward movement is likely in the cards.
Source: TwitterIn this scenario, the BTCD rate is currently nearing the top of the B wave of an A-B-C corrective structure (red). This would complete a longer-term wave 4 (blue).
The rejection and decrease both align with the rejection from the descending resistance line and short-term Fib resistance levels.
BTCD Chart By TradingViewAs for the longer-term wave count, it appears that BTCD is in sub-wave 4 (blue) of a longer-term wave 3 (black).
Therefore, after the current decrease is complete, the BTCD would be expected to increase once again.
BTCD Chart By TradingView ConclusionWhile a short-term retracement could occur, the BTCD is expected to eventually break out from the current descending resistance line and continue moving higher.
For BeInCrypto’s latest Bitcoin analysis, click here!
Disclaimer: Cryptocurrency trading carries a high level of risk and may not be suitable for all investors. The views expressed in this article do not reflect those of BeInCrypto
The post Bitcoin Dominance (BTCD) Bounces Back After Failing to Overcome Resistance appeared first on BeInCrypto.
origin »Bitcoin price in Telegram @btc_price_every_hour
Resistance (RES) на Currencies.ru
|
|