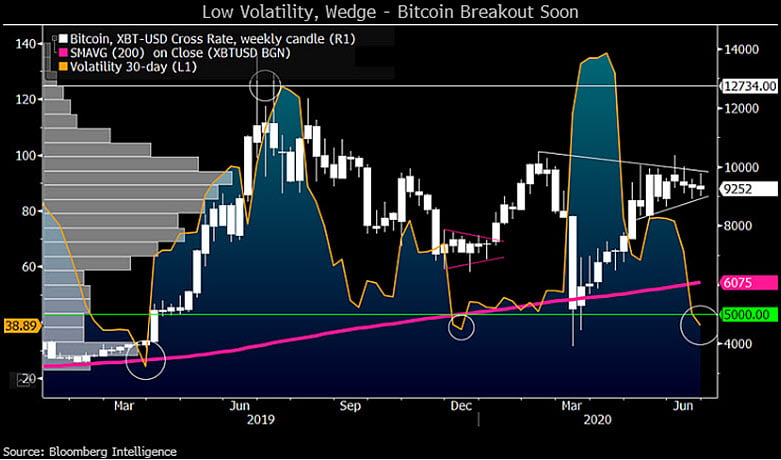
Bitcoin is at risk of undergoing a significant breakdown as it consolidates inside a compressive technical pattern.
The analogy surfaced as an analyst compared Bitcoin’s latest trend with the one from 2019.
He noted that the cryptocurrency consolidated inside a similar Symmetrical Triangle range last year before breaking down towards $6,500 from $14,000-top.
As Bitcoin’s modest rally this week comes to halt, analysts have started expressing their worries of a bigger downside move ahead.
Cryptocurrency trader Josh Rager shared a BTCUSD chart Friday morning that showed the pair trending inside a contracting trading range. The pattern looked like a Symmetrical Triangle, confirmed by two converging trendlines connecting a series of Bitcoin’s sequential peaks and troughs.
Mr. Rager pitted the pattern against its twin from 2019. Right after Bitcoin established a year-to-date top near $14,000, it started consolidating inside a Symmetrical Triangle-like fractal. The outcome was a negative breakout. The BTCUSD pair broke below the lower trendline in September and crashed towards $6,500 in the next three months.
Bitcoin repeating the 2019 fractal hints of a breakdown move ahead. Source: Josh Rager, TradingView.com
Mr. Rager also discussed events that led to the formation of these Symmetrical Triangles. The 2019’s top of $14,000 followed a parabolic uptrend from Bitcoin’s bottom near $3,120 – established in December 2018. Similarly, the cryptocurrency rose to circa $10,500 this year after bottoming out near $3,800 in March 2020.
“It’s almost time,” Mr. Rager said in a cryptic tone. “Two moves from $3k to over $10k. Both with compression at the top.”
That Missing Bitcoin Buying Sentiment
The 2019 fractal saw an absence of new buyers at the $14,000-top. That led to a massive price correction towards $9,000, followed by another attempt to retest the YTD high. However, the price could only go as far as $13,200.
The same happened in 2020. Bitcoin topped at $10,500 but failed to extend its upside momentum in the wake of higher selling pressure. The price later corrected towards the $8,600-9,000 range multiple times. It attempted a rebound towards $10,500 but got stopped near or below $10,000.
Bitcoin’s upside attempts remain capped by a long-term descending trendline resistance (red). Source: TradingView.com
The downside risks remained higher also because of a long-term Descending Trendline pattern. Since 2017, Bitcoin has attempted but failed to close above the ‘red’ trendline. It psychologically prompts traders to reduce their bullish exposure above the so-called price ceiling.
Combined with Josh Rager’s “compression” fractal, these technical indicators hint that Bitcoin may break bearish in the coming sessions.
One Bullish Indicator, Meanwhile
Switching the BTCUSD timeframe from daily to weekly paints a rather bullish picture for the pair. So it appears, Bitcoin has printed a Golden Cross – a technical indicator that hints about a buying session ahead. Meanwhile, its weekly RSI is also holding support above 52 – historically bullish.
Bitcoin Golden Cross and RSI readings suggest a sustained bullish bias. Source: TradingView.com
At best, the weekly chart indicates that Bitcoin may fall towards its 50-week moving average (the blue wave) for a potential pullback towards the descending trendline. It may lead up to a price breakout, with the next resistance range lurking around $11,500-$12,000.
Meanwhile, breaking below the 50-WMA could lead prices towards lower $6,000s – just like Josh Rager’s fractal suggests.
Photo by Joanna Nix-Walkup on Unsplash origin »
Leading Bitcoin higher, global stock markets saw an extremely strong performance on Monday. As covered by NewsBTC, the Shanghai Composite index and the FTSE China A50 index both set new all-time highs on a 6% surge.
With over 11 Million Bitcoin. com Wallets created, we’re building new features our users need most in order to enjoy the best possible cryptocurrency experience. Our wallet’s latest features now provide seamless swaps between bitcoin (BTC), bitcoin cash (BCH), and the stablecoin honestcoin (USDH).
The bitcoin chart shows an interesting inverse fractal from 2019. The Feb-March price action last year, which resulted in a breakout, hints a breakdown for Bitcoin in 2020. Bitcoin is currently moving in the same manner as it did back in 2019 – just inversely.
Bitcoin price is trending inside a lengthy consolidation pattern after rallying by up to 170 percent in the second quarter. As calls for a breakdown move grow, independent market analysis firm TradingShot has released a bullish outlook for the cryptocurrency.
Despite seeing a swift rebound, Bitcoin bears were able to push the cryptocurrency below its crucial $9,000 support just minutes ago. This breakdown has come about following a recent rejection posted by the crypto at $9,300, which appears to have become a resistance level.
Disclaimer: This article attempts to foresee the price movement of Bitcoin SV over a period of the next 24-hours.
Bitcoin SV saw a major downward breakdown on the 27th of June. Soon after encountThe post Bitcoin SV short-term price analysis: 29 June appeared first on AMBCrypto.
Ethereum, like Bitcoin, is currently trading at the lower boundary of its long-established trading range The cryptocurrency does appear to be positioned to see a breakdown below this range, but whether or not this takes place will likely depend on Bitcoin One analyst is now growing increasingly cautious on ETH, explaining that massive spikes in miner outflows for the cryptocurrency signal that a large drop could be imminent This also comes as the China-based PlusToken […]
Bitcoin price is eyeing a breakout towards $13,000, according to Bloomberg analyst Mike McGlone. The senior commodity strategist stated that the cryptocurrency’s declining volatility is making it a digital version of gold.
Ethereum and the entire cryptocurrency market faced some turbulence yesterday as Bitcoin declined beneath its range lows of $9,000 This movement proved to be short-lived, as the buying pressure found here quickly propelled the cryptocurrency back up into its long-held trading range Although this hasn’t provided the markets with any clear direction, it did allow ETH to narrowly avoid posting a major breakdown The second-largest crypto was able to bounce at a critical support level, […]
Since April 30, the Bitcoin price has been trading in a range between $10,050 and $8,500. The price movement inside this area is akin to the distribution phase of a Wyckoff distribution, meaning a breakdown from the range would be expected.
A bearish chart formation has appeared on Bitcoin dominance that could lead to another leg down and rebound in altcoin/BTC pairs. However, the 58% level could remain a barrier, keeping a full-blown altcoin season from occurring for quite some time longer.
Despite a booming stock market that is nearing all-time highs, Bitcoin has been stalling in the $8,000s and $9,000s. The relative weakness BTC has expressed compared to equities has had some worried, worried to the point where some are expecting a strong price breakdown.
It’s no secret that XRP has been one of the worst performing cryptocurrencies throughout the past couple of years, woefully underperforming both Bitcoin and its USD trading pair. This underperformance may soon extend even further, as analysts are noting that the crypto is on the cusp of seeing another breakdown as it hovers just above...
The Bitcoin price is possibly following a Wyckoff distribution pattern, a breakdown of which could see a sell-off down to between $6,000 – $7,000. First things first, what is the Wyckoff distribution? The analysis method explains a period of consolidation, which occurs after an upward move, serving as a way for market makers to sell […]
The post Bitcoin Poised to Fall? This Wyckoff Distribution Pattern Says So appeared first on BeInCrypto.
The Bitcoin dominance rate (BCD) has fallen to a major support level, a breakdown below which could indicate a bullish period for altcoins. However, both LTC and XRP have fallen below almost year-long support levels and have yet to show clear signs of reversal.
The Bitcoin price has been decreasing since it reached a high on May 8. It has reached an important support level, a breakdown from which would indicate that the upward move beginning on March 13 has ended.
The Bitcoin price has been gradually decreasing since May 14 and has reached an important support level at $8,400. A breakdown below it would confirm the bearish trend and make the movement until now a part of a bearish Wyckoff distribution.
Following an extended bout of sideways trading within the $9,000 region, Bitcoin has now firmly broke below this range as it trades around $8,800 Although the crypto has ardently defended its near-term support, its technical outlook does appear to be rapidly degrading Some analysts are even noting that its latest breakdown has opened the gates for it to see a movement that leads it as low as $5,900 in the weeks and months ahead Bitcoin […]
During the week of May 17-24, the Bitcoin price decreased considerably. It created a bearish engulfing candlestick that caused it to decrease all the way to an important support level. A breakdown below this support could indicate that the price has begun a new bearish trend.
Bitcoin started a strong decline after it broke the key $9,500 support against the US Dollar. BTC price is currently correcting higher from the $8,794 low, but upsides are likely to remain capped. Bitcoin is down more than 5% and it broke many key supports near $9,500 and $9,150. The price is now trading well...
XRP has continued to severely underperform Bitcoin, forcing it to also see some downside against its USD trading pair despite the bullish market conditions This weakness has caused the third-largest crypto to decline beneath a key last-ditch support level that was bolstering its price action Analysts are now noting that it could soon see a freefall that leads it significantly lower due to the weakness resulting from this dire technical breakdown Yesterday the aggregated crypto […]
On April 30, the Bitcoin (BTC) price reached a high of $9485 and dropped shortly after. The movement since shares some resemblance to a bearish Wyckoff distribution pattern — out of which a breakdown is expected.
Ethereum has seen a slight rejection from its recent highs in the time following its decline from just below $200 Analysts are noting that there are multiple separate technical factors that point to an imminent breakdown One such factor is a major decline seen in the cryptocurrency’s buying pressure, which has been dissolving throughout the past several days and weeks Ethereum has been closely tracking the price action seen by Bitcoin in recent times. This […]
The Bitcoin price is approaching a crucial resistance level that is likely to determine its future trend. While a breakout above it could take the price towards $8,000, a breakdown would likely cause a sharp drop towards $6,300.
On April 13, the Bitcoin price began to decrease in what initially seemed like a breakdown below the support level at $6,750. However, it quickly reclaimed the lost support and has increased gradually since.
Bitcoin started the week on shaky ground after bears pushed it below the critical support level around $6,750. As BeInCrypto previously reported, a decrease below $6,800 could potentially trigger a rapid breakdown.
Bitcoin is showing a few bearish signs below the $7,400 resistance area against the US Dollar. BTC price is currently declining and it could extend its weakness towards $7,100 or $6,800. Bitcoin is struggling to clear the $7,400 and $7,500 resistance levels against the US Dollar.
On March 20, the BTC price reached a high of $6,900. Since then, it has been mostly trading in a range between $6,100-$6,900, with the exception of a failed breakdown attempt on March 27. On April 2, the price initiated a rapid upward move and reached a high of $7,192, however, the higher prices could […]
The post Bitcoin’s Price Action Resembles a Bearish Wyckoff Distribution appeared first on BeInCrypto.
On March 13, the BTC price reached a low of $3,850. While this initially seemed to cause a breakdown below numerous support levels, the price immediately began an upward move and proceeded to reach a monthly close above $6,000.
The March 12 Bitcoin plummet was a collectively woeful period for altcoins as well. With the premier cryptocurrency holding over 60 percent of the total coin market, altcoins bleed with Bitcoin, and nThe post Dash, NEM and Bitcoin Cash price: Altcoins recover post breakdown appeared first on AMBCrypto.
The Bitcoin dominance rate has reached a significant resistance area and decreased afterward as a result. The fact that it is trading inside a bearish pattern makes a breakdown likely. Well-known trader @KingThies stated that he has noticed the reduced engagement in altcoin posts and the fact that the prices are very near all-time lows.
Bitcoin is facing a strong resistance near the $7,000 level against the US Dollar. BTC price is likely forming a double top pattern near the $7,000 level and it could dive below $6,400. Bitcoin is forming a bearish breakdown structure below $7,000 against the US Dollar.
Bitcoin is in for more jump scares after having fallen by more than 50 percent this week. With the expanse of Novel Coronavirus rippling through financial markets, bitcoin plunged from $10,000 in February to $3,858 as of Friday.
Throughout the course of the crypto market’s firm 2020 uptrend, Bitcoin’s steady climb has allowed most major altcoins to post decent gains, although none have come close to competing with those seen by Chainlink and Tezos.
After an attempt to break through the multi-week low of $8,400 this weekend, Bitcoin bounced back. Hard. Over the past 24 hours, the cryptocurrency has surged higher from $8,600 to as high as $8,970, nearing $9,000 for the first time since the brutal breakdown on February 26th.
Ethereum (ETH) has been closely tracking Bitcoin over the past week, which has exposed it to significant downwards pressure that has erased nearly all of the massive upside it incurred throughout the early part of this month.
In less than 4 hours, Bitcoin lost almost 6 percent of its value, undoing weeks of bullish momentum, with the Futures market having a field day. Putting an end to a month that began with a golden crosThe post Bitcoin's breakdown may be worse than you think appeared first on AMBCrypto.
Key Highlights BTC/USD pair currently trades in a range moving outlook around $10,000 and $9,600 market levels. A breakdown of the lower range point at $9,600 will let the pair find support between $9,200 and $8,800 price levels.
With blockchain puppets (we really mean it) on TV, CNBC pushing the bitcoin-as-gold narrative and The Guardian seeing connections between coronavirus and bitcoin's recent rally, we've got a lot to talk about on today's episode of The Breakdown.
The Bitcoin dominance rate was rejected strongly at the 72 percent level and has been decreasing since, causing a breakdown from its pattern. Bitcoin Dominance Highlights The Bitcoin dominance rate broke down from a symmetrical triangle.
Bitcoin price failed to continue above the $9,500 resistance and declined recently against the US Dollar. BTC could either bounce back from $9,150 or it might decline heavily. Bitcoin bulls are fighting hard to protect the key $9,200 and $9,150 support levels against the US Dollar.
A calm and balanced question to Craig Wright about whether or not he has access to Satoshi Nakamoto’s $9 billion bitcoin wallet met with a bizarre response: “It’s none of your goddamn business.
Once Bitcoin (BTC) started to incur strong losses in the second half of 2019, analysts were once again making extremely low price predictions. Long-time Bitcoin skeptic Peter Schiff, who is CEO of Euro Pacific Capital, wrote in a late-2019 tweet that per his technical analysis of the charts, BTC’s breakdown below the $7,000 range could […]
The post This analyst says there’s a “high chance” Bitcoin may never fall under $5k again appeared first on CryptoSlate.
Bitcoin Price Highlights The Bitcoin price has moved above its 100-day moving average (MA). There is resistance at $8600. The short-term movement has become parabolic. The price has reclaimed the previous breakdown level.
Bitcoin Price Highlights The Bitcoin price broke down from a head and shoulders(H&S) pattern. The breakdown could not be sustained. The price created a bullish morning star pattern. The price has possibly created a longer-term inverse H&S pattern.
Bitcoin price is consolidating above the $95,000 support zone. BTC must settle above the $100,000 level to start a fresh increase in the near term. Bitcoin started a fresh increase from the $94,200 zone.
Bitcoin price started a fresh upward move above $100,000. BTC is facing resistance at $103,000 and might aim for an upside break. Bitcoin started a decent upward move above the $100,000 zone. The price is trading below $103,200 and the 100 hourly Simple moving average.
Bitcoin price settled above the $100,500 resistance zone. BTC is consolidating gains and might aim for a fresh increase above the $105,000 zone. Bitcoin started a downside correction from the $106,800 zone.