Outlining Bitcoin’s Possible Wave Count

Outlining Bitcoin’s Possible Wave Count
фото показано с : beincrypto.com

2020-5-27 21:20

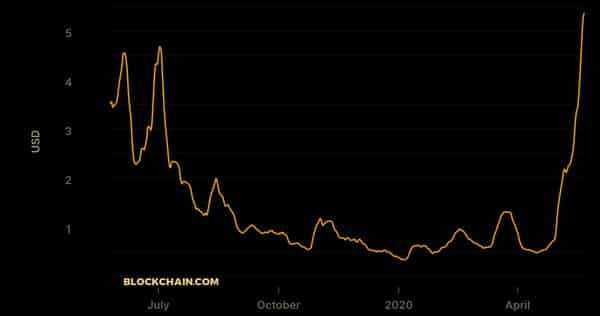
The Bitcoin price has been decreasing since it reached a high on May 8. It has reached an important support level, a breakdown from which would indicate that the upward move beginning on March 13 has ended.

Well-known cryptocurrency trader @CryptoCapo_ outlined a bearish wave count for BTC that shows that the price is nearing the end of this retracement and will eventually break down from its channel.

Source: Twitter

He stated that the current movement is a retracement rather than an impulsive formation since the price is trading inside a perfect channel:

A perfect channel means that this is not an impulsive pattern.

This means that if the current movement was an impulsive pattern that would eventually lead to higher prices, the price would have over/under-thrown the resistance or support lines of the channel before moving back inside it.

In the image below, we have outlined a possible wave count since the March 13 low, in which BTC has already completed a W-X-Y correction. It is possible to draw a parallel ascending channel which encompasses all of the highs and lows, however BTC has just broken down from it.

Therefore, while this could definitely be a W-X-Y correction that has been completed, and the price will move downwards as a result, the parallel channel does not seem like a valid enough reason to make this claim.

Bitcoin Chart By Tradingview

If the upward movement is considered a correction, than the ensuing downward movement would be the impulsive formation, and BTC would soon decrease at an accelerated rate, once it breaks down from the possible ascending support line it has been following since March 13.

Bullish Possibility

However, the price is still following the aforementioned ascending support line and is trading near the horizontal $8,550 support level. Until the price breaks down from it, the possibility that this is an impulsive five wave formation is still there.

If so, the price is currently in wave 4, which is correcting inside an a-b-c-d-e triangle. A breakout above the dashed resistance line would increase the likelihood that this is the correct formation.

Bitcoin Chart By Tradingview

To conclude, the BTC price is trading at a crucial support level. Whether it breaks down or bounces from it will be pivotal in determining the direction of the future trend.

The post Outlining Bitcoin’s Possible Wave Count appeared first on BeInCrypto.

Similar to Notcoin - Blum - Airdrops In 2024

origin »

Bitcoin (BTC) на Currencies.ru

$ 67482.46 (+0.08%)
Объем 24H $11.659b
Изменеия 24h: -0.22 %, 7d: -2.41 %
Cегодня L: $67390.1 - H: $67835.76
Капитализация $1329.844b Rank 1
Цена в час новости $ 8864.85 (661.24%)

reached bitcoin indicate breakdown upward ended march

reached bitcoin → Результатов: 126


Мнение: Мы достигли территории капитуляции майнеров биткоина

В последние недели майнеры биткоина превратились в чистых продавцов криптовалюты и тенденция усиливается, считает криптоаналитик под ником CryptoKea. We reached #Bitcoin miner capitulation territory.

2020-5-27 18:21


Фото:

Аналитик: капитуляция биткоин-майнеров началась

В последние недели майнеры биткоина превратились в чистых продавцов криптовалюты и тенденция усиливается, считает криптоаналитик под ником CryptoKea. We reached #Bitcoin miner capitulation territory.

2020-5-27 15:37


Фото:

Bitcoin Halving Hype Could Give Way to Consolidation or Retracement, But what about Altcoins?

Just four days away from halving, we have some interesting next few weeks ahead of us. The world's leading digital asset is already enjoying an uptrend, currently trading above $9,800, breaking off its relation with equities after the correlation between them reached a peak during the past couple of months. This short pump is rolling […]

2020-5-7 20:58


Фото:

Outlining a Bullish Wave Count for Bitcoin

The Bitcoin price has reached a descending resistance line that has been in place for more than two years. A breakout above this line would have major bullish implications for the future price. Well-known trader @crypto_rand outlined a BTC chart that shows a possible bullish pennant, which he believes could cause a breakout, giving a […] The post Outlining a Bullish Wave Count for Bitcoin appeared first on BeInCrypto.

2020-5-6 23:20


Фото:

Bitcoin‘s Fate May be Determined By How it Responds to this Single Level

Bitcoin pushed higher overnight as bulls attempted to firmly surmount the $9,000 region, although the crypto faced yet another rejection at these price levels One fund manager is now noting that BTC’s current price region seems like a logical place for its uptrend to stall This comes as a respected trader notes that the crypto has reached a pivotal price level that could determine its fate in the weeks and even months to come Bitcoin […]

2020-5-1 21:00


Black Thursday Has Destroyed BitMEX Bitcoin Open Interest, Hits Historical Lows

The cryptocurrency margin trading platform that once enjoyed the crown across the industry, has just reached a historical low on the platform’s now-notorious Bitcoin open interest. According to data, the once industry leader has been on a downward trajectory ever since the Black Thursday collapse that not only crushed Bitcoin prices, but may have put...

2020-5-1 20:30


Фото:

Bitcoin’s Breakout: New Upward Move or Retracement?

On April 29, the Bitcoin (BTC) price broke out from a short-term ascending channel that had been in place for the past five days. The price reached a high of $7966 before decreasing slightly. Bitcoin’s Breakout After five unsuccessful attempts at moving above the resistance line, the Bitcoin price finally managed to move above it […] The post Bitcoin’s Breakout: New Upward Move or Retracement? appeared first on BeInCrypto.

2020-4-29 14:58