2022-10-6 23:19 |
In this episode of NewsBTC’s daily technical analysis videos, we look at the latest move up in Bitcoin price using the Bollinger Bands across a variety of timeframes and explain why a close above the upper band could lead to a larger move to the upside.
Take a look at the video below:
VIDEO: Bitcoin Price Analysis (BTCUSD): October 4, 2022Bitcoin price had another decent sized move up to above $20,000 after continuing to respect a rounded trendline.
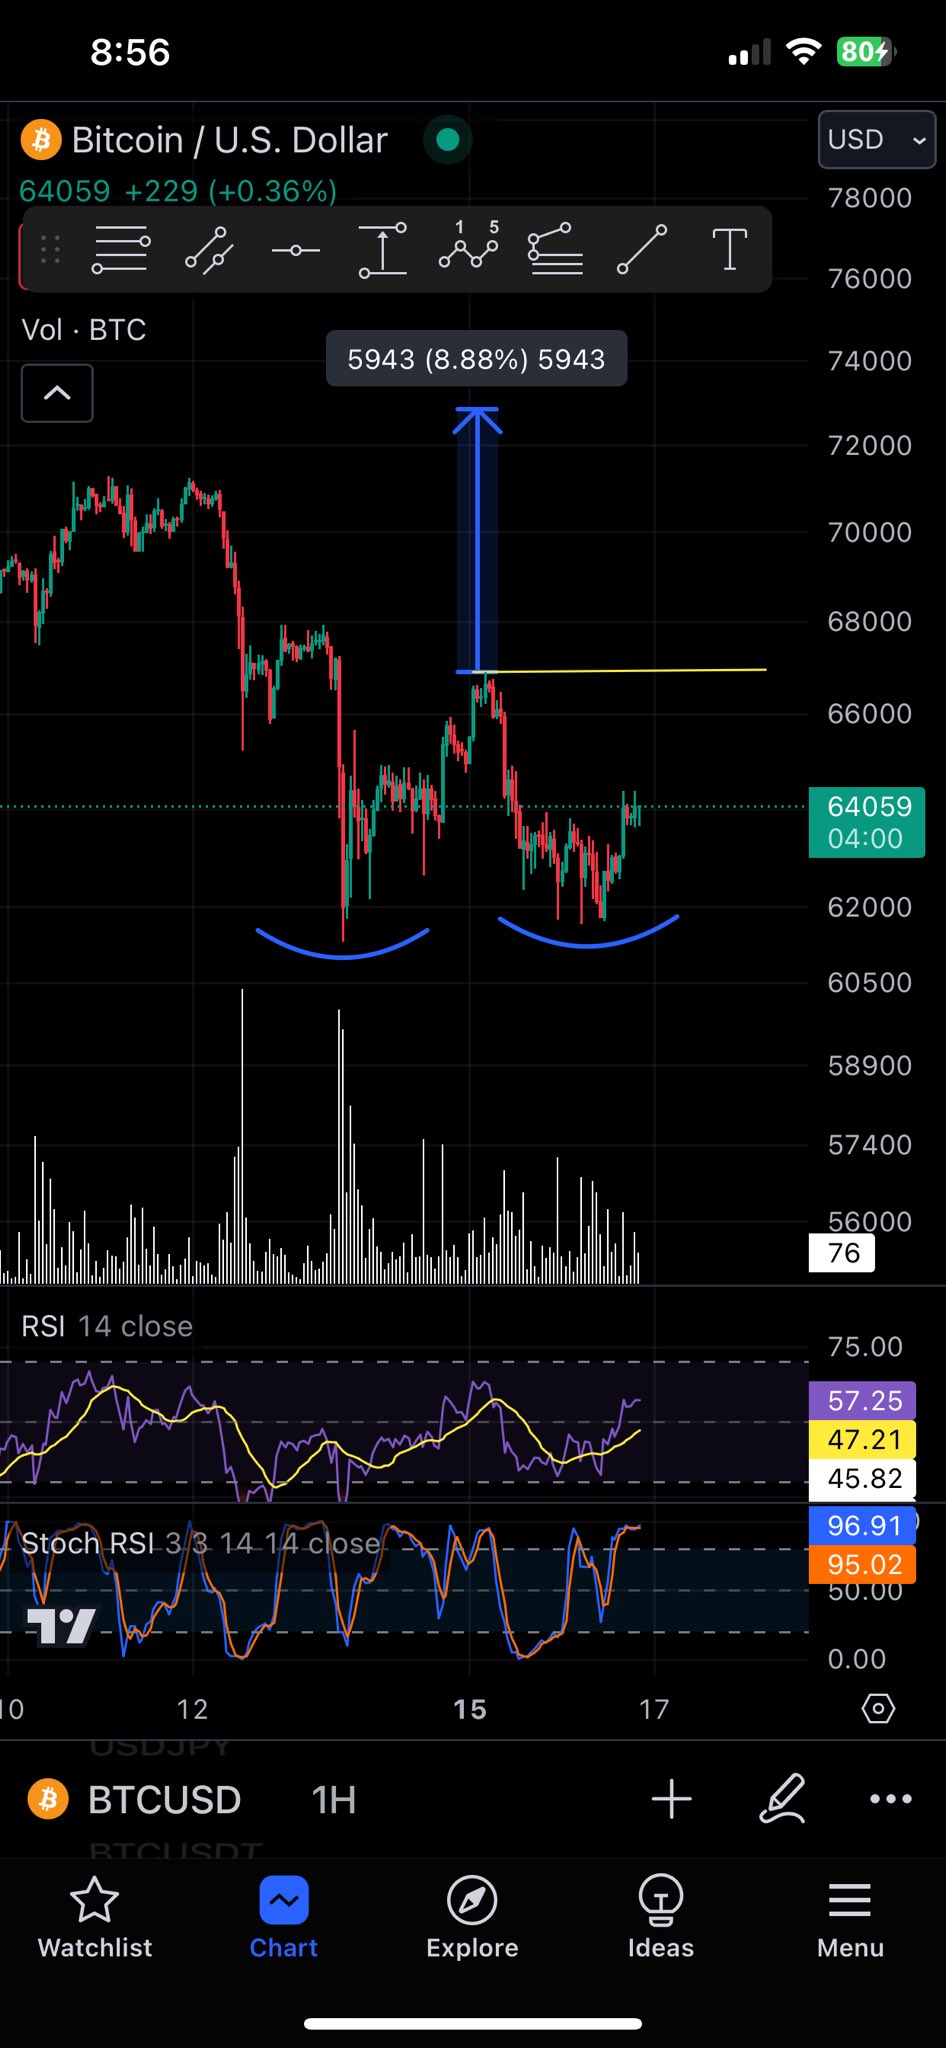
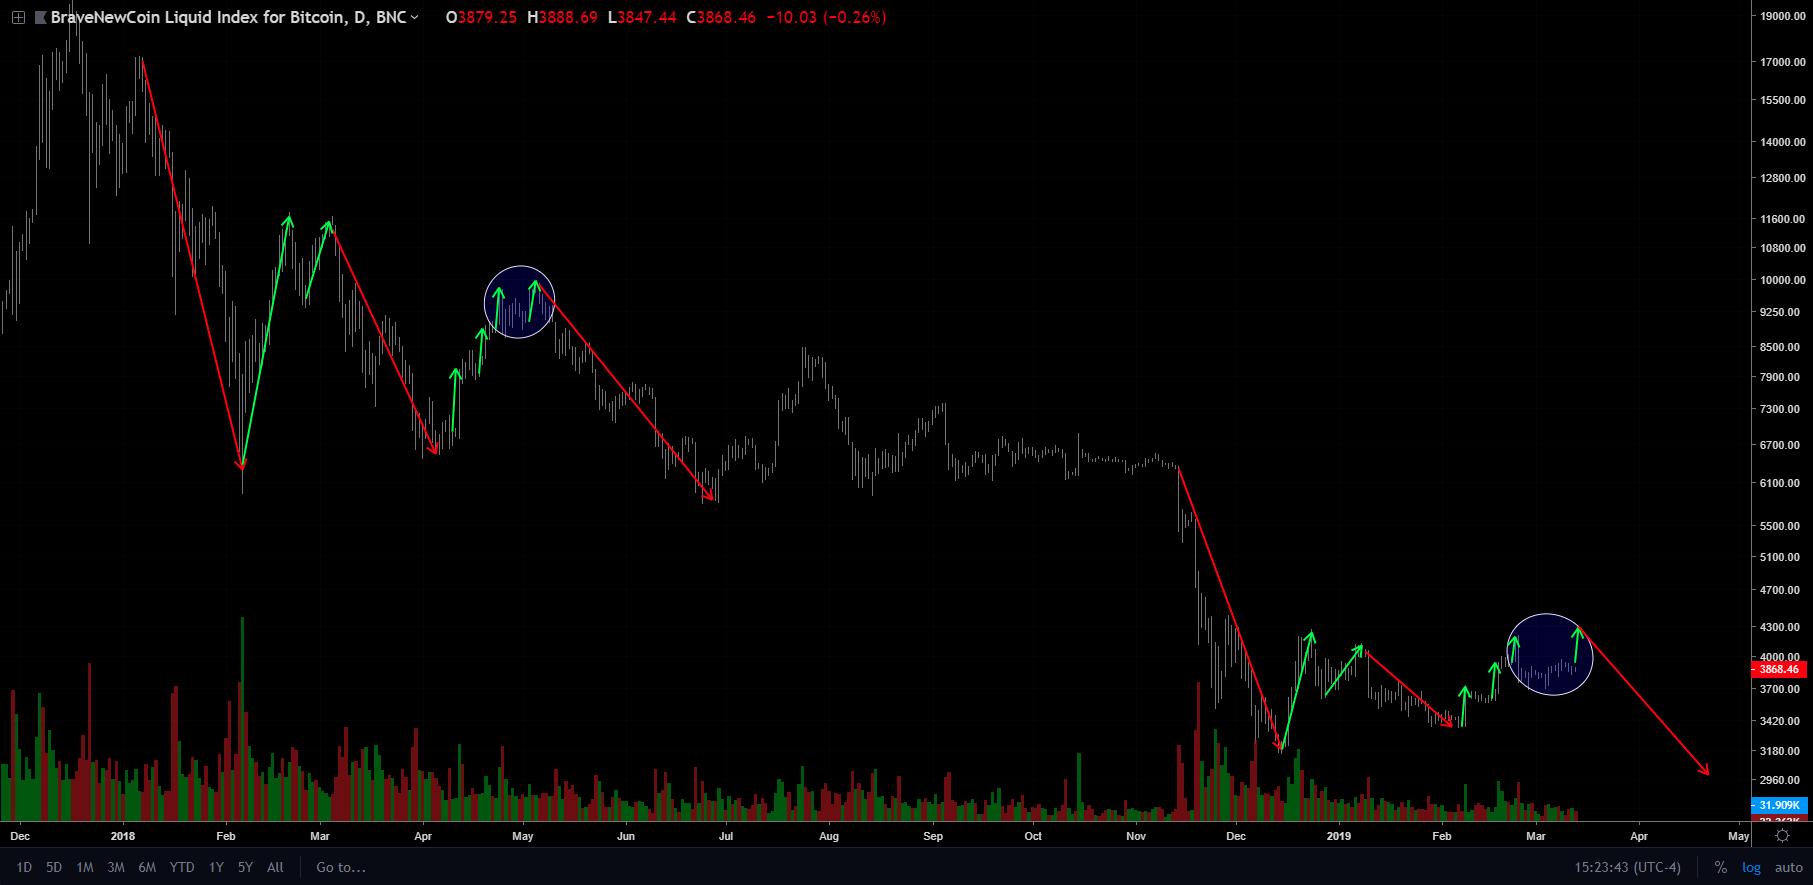
Biblical Bear Market Bottom Pattern Is BackThe rounded bottom would be the second half of an Adam and Eve double bottom formation. This is the same pattern that resulted in the 2018 bear market bottom and is characterized as a V-shaped correction followed by a slower rounded bottom.
Is another bear market bottom building? | Source: BTCUSD on TradingView.com Crypto Market Gears Up To Ride The BandsBitcoin’s latest move up is particularly notable due to the daily close taking place outside of the upper Bollinger Band. As you can see from the last time this happened, it can lead to a strong rejection back to the mid-BB. Holding above this level could lead to a larger move to the upside.
Expansions in volatility are most important and worth paying attention to, as the tool’s creator would probably say himself. When the Bollinger Bands squeeze, it is a sign of low volatility – a short-lived phase that always ends with a bang and large move.
Closing today’s daily above around $20,350 should do the trick and keep Bitcoin above the upper band. If not, the next logical target is likely the middle-band at $19,400.
Will Bitcoin ride the bands higher? | Source: BTCUSD on TradingView.comRelated Reading: Is Bitcoin ‘Uptober’ About To Begin? | BTCUSD Analysis October 3, 2022
Monthly Bollinger Bands Give Two Possible TargetsThe monthly Bollinger Bands were tapped for the first time in Bitcoin history during this bear market. This suggests that Bitcoin price is extremely low relative to monthly price action historically and it could imply a buying opportunity.
The lower band is drifting downward, which means if Bitcoin continues downward also, the next target could be as low as $12,000 before more dynamic support is found. If Bitcoin heads back toward the upper band, $60,000 BTC is the target instead, making the setup decent in terms of risk versus reward.
However, if Bitcoin can maintain upward momentum, a new uptrend could confirm. The TD Sequential isn’t just helpful for finding potential turning points when the series reaches a 9 or 13, a new 1 can often signify the start of a new uptrend and is yet another important signal.
Does the 1 signify a new uptrend forming? | Source: BTCUSD on TradingView.com Bitcoin And Nasdaq Form Potentially Bullish Q3 CandleWhen the September monthly candle closed it also closed the third quarter of the year. Q3 left a doji on the Bitcoin price chart. Doji show a point of indecision and because of this, they are often found prior to a reversal, or prior to strong continuation.
A high timeframe morning star doji could bring the reversal bulls need and would support a monthly push to $60,000 within the next three months. Whether BTC can hold above that level or not remains to be seen.
It is worth noting that larger hedge funds and institutional investors take positions based on a quarterly basis, which could explain why markets sharply reversed to start the month of October. On the right, the Nasdaq also formed a bullish inverted hammer on the quarterly, which also could be a sign that Q4 is profitable for risk assets like crypto and tech stocks.
Are these reversal signals on the BTC and NDX quarterlies? | Source: BTCUSD on TradingView.comLearn crypto technical analysis yourself with the NewsBTC Trading Course. Click here to access the free educational program.
Follow @TonySpilotroBTC on Twitter or join the TonyTradesBTC Telegram for exclusive daily market insights and technical analysis education. Please note: Content is educational and should not be considered investment advice.
Featured image from iStockPhoto, Charts from TradingView.com origin »Bitcoin price in Telegram @btc_price_every_hour
Bitcoin (BTC) на Currencies.ru
|
|