2019-3-14 13:00 |
Sentiment among traders and speculators in the market is extremely temperamental, swinging between bearish and bullish on an almost daily basis. The charts are relatively neutral but pressure is certainly building in the Bitcoin (BTC) market. Let’s take a closer look at the action.
1-Day ChartThe one-day chart for Bitcoin (BTC) shows that, since the decline following the three-wave run up to $4200 during February, Bitcoin has been range bound — swinging around four percent either side of the March opening and establishing a monthly range between $3670 and $3950.
Overall, the chart remains is in a bottoming pattern; with the current price action attempting to put in a third higher low — but the bulls are struggling to break across $3950 and conquer the $4000 handle.
The MACD is relatively flat but has crossed marginally bearish — although, still above zero — so this does not particularly lend itself to being indicative of a direction.
The DMA 50 and 100 are crossed bullish and lie right on the monthly support and 61.8 percent retracement of the February move at $3670.
Should these fail to hold as support when interrogated by the bears, the 200 WMA lies some way below at $3400 and would act as the last line of defense for the bulls.
4-Hour ChartThe four-hour chart shows that Bitcoin (BTC) price action remains at the upper end of the monthly range and previous tests of the lows have been bought up quickly by the bulls.
However, the charts are leaning slightly bearish on lower timeframes, with a cross on the StochRSI crossed bearishly and a Head and Shoulders top threatening to form — which would indicate that a retest of the monthly range lows at $3670 would be on the cards. Should it fail on the third time of asking, it would imply a fast move to the lower $3500s would be possible.
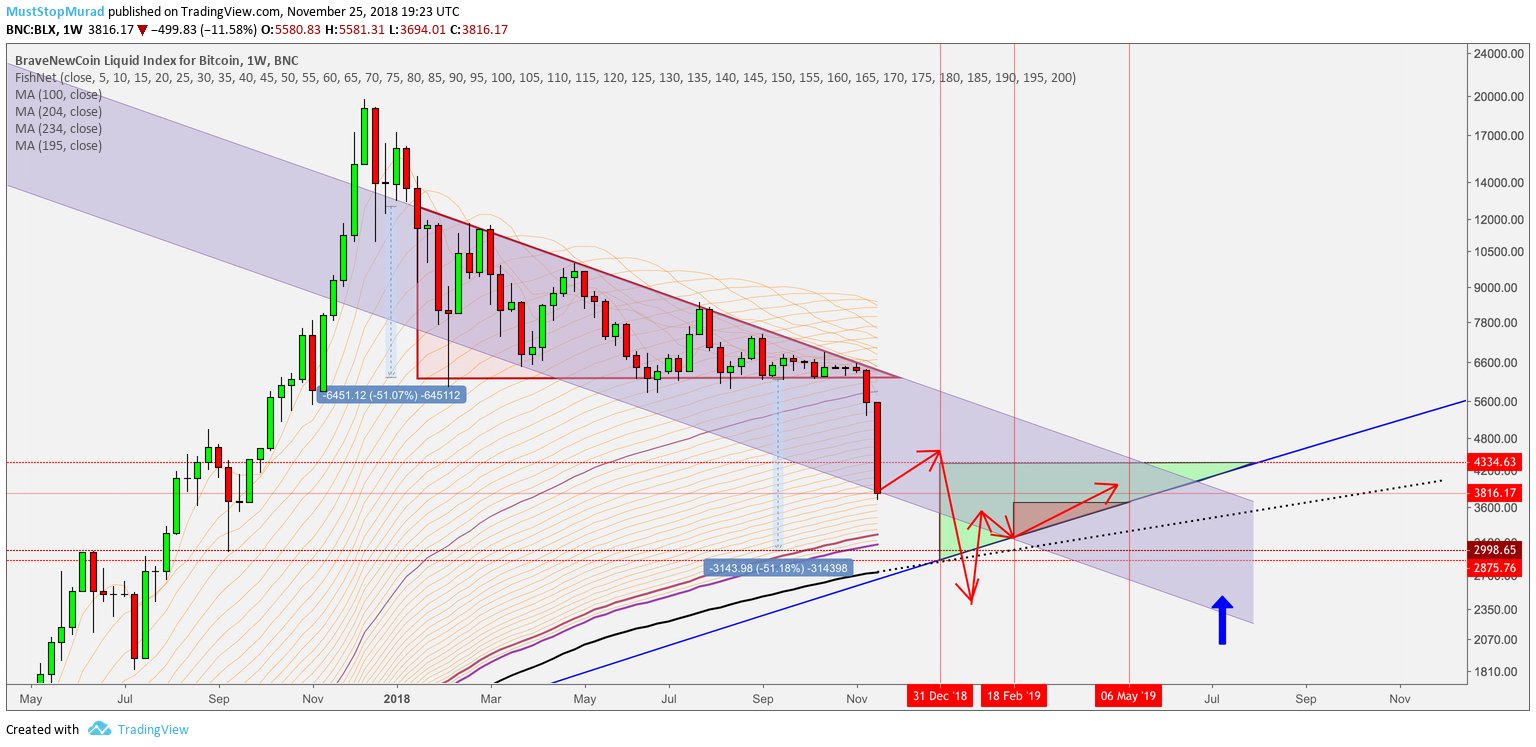
Weekly ChartLooking at the bigger picture, we can see that Bitcoin is being capped by the 20-week moving average and supported by the 200-week moving average. This implies that whichever boundary proves to subside will be indicative of what the direction of travel may be for the next few months — and it was key when Bitcoin bottomed during 2015, although there is no guarantee that the same will occur during 2019.
Finally, looking at the structure of the market and in comparison to prior years where Bitcoin had indeed attempted to find a definitive close to the bear market, we can see why traders and speculators alike are at odds as to what will occur next.
The market posture is that of a market bottom, but as we have seen in the past, it can take multiple attempts before a bottom can be found. If the bulls win the battle, $5,000 will be the target. Should the bears take control, mid $2000s would be in sight for the bears.
Only time will tell what will happen next, but pressure is building and it implies we will get a definitive move by the end of March.
Trade Bitcoin (BTC), Litecoin (LTC) and other cryptocurrencies on online Bitcoin forex broker platform evolve.markets.
To get receive updates for the writer you can follow on Twitter (@filbfilb) and TradingView.
All charts courtesy of TradingView.
The views and opinions of the writer should not be misconstrued as financial advice. For disclosure, the writer holds Bitcoin at the time of writing.
The post Bitcoin Price Analysis: Pressure is Building appeared first on Bitcoinist.com.
origin »Bitcoin (BTC) на Currencies.ru
|
|


